The power of mapping
When organizations decide to dive into web mapping, it’s common that they won't have all map-ready data required to deploy maps. In most cases, you’ll have data across a range of databases and spreadsheets, with place names, or addresses, or zip codes.
Unfortunately, none of these data resources are what we’d call map-ready data. In most cases, you will need to source and prepare data from a third party source, and merge it with your existing business data.
It’s never too late to start
By learning the core basics of map data preparation, you’ll have a valuable skill that can provide ongoing benefits for your business.
You’re probably already collecting lots of valuable data. Many business tools and databases already contain a mountain of useful location information: Addresses, place names like state and county names, or even administrative codes like zip codes, or fips codes are all super useful for visualizing business data on maps.
Taking that location data, and merging it with map-ready spatial data can seem like a massive barrier to entry into web mapping and online GIS, but it really doesn’t have to be.
We’ve put together a range of useful tutorials and guides to help you really get the most out your business data, but joining and combining it with existing map-ready data, and exploring the insights that web map visualizations offer. They’re detailed, and require zero knowledge of mapping or GIS.
They also can be achieved on any PC using free software. Desktop GIS client QGIS is our preferred GIS application. It’s free, and open source, and has a plethora of community developed tools that can do amazing things with map data.
We’ll show you step by step how some simple workflows to join your data to map data, convert addresses to map coordinates, tidy your map data and remove unwanted areas so your maps are super focused, and more.
Before we begin, it’s important to note that maps are only as good as the data they’re made with. First things first, we need to source some great map data that corresponds with your own spreadsheets.
If you’ve already got map ready data to work with, along with your own spreadsheets, feel free to jump ahead to the preparation section below.
Sourcing GIS Data
If your data corresponds to commonly agreed boundaries, such as states, counties, or any other administrative boundary, you’re in luck! The good news is that there is a ton of useful map data for use, completely free and without restriction, with spatial datasets covering just about anything you can think of.
The bad news is that there isn’t one single authoritative source of map data. Locating data will require a little time, a little patience, and a search engine.
Watch our detailed screencasts that cover the whole process of sourcing and preparing map-ready data to visualize on interactive web maps and online GIS systems.
► Watch now
When looking for spatial data it’s best to start with Google, and simply search for the name of the dataset you want followed by the word Shapefile. Of all spatial data formats, shapefiles are the most ubiquitous, so you’re more likely to get a larger range of results than searching for some other formats.
When seaching you may come across other formats such as KML, GeoJSON, Tab Files or GeoTiff's, but Shapefile's are usually the easiest to find.

Search for “texas counties shapefile”
Shapefiles are usually provided as a zip containing the various files for the Shapefile.
Many map dataset portal don’t offer example maps of the datasets they offer, so it’s usually necessary to download the data and open it in a desktop GIS to see what the dataset contains.
If you don’t have any luck with Google, then the next step is to be more direct.
In the US, Canada, and Europe, most national and local government websites will have a GIS section that contains GIS data available for download. These sites are often not very user friendly, so finding and downloading things can be a challenge. Perseverance is the key!
If all else fails, you can try contacting people who might have access to the data and asking if you can use it. For example if you wanted to map the forests of California and couldn’t find the relevant GIS data, you could try emailing the state forestry office to see if they can share their data.
Most open data available for download online is available for use without restriction, but sometimes restrictions are in place on redistribution of the data, or simply that attribution of the data source is required. Either way, crediting the source when using third party data on your maps is the polite thing to do.

A public domain notice on a data portal, meaning that the data is free from any copyright restrictions, and is therefore free to use and share the data.
Free GIS Data Portals
You’ve got your data, but what happens when you need to visualize it against something else, like regional employment data, or solar PV capacity by region?
There’s a plethora of freely available GIS data out there – some good, some bad – so here’s 3 fantastic spatial data repositories well worthy of a coveted spot on your bookmarks bar.
Robin Wilson’s Free GIS Data
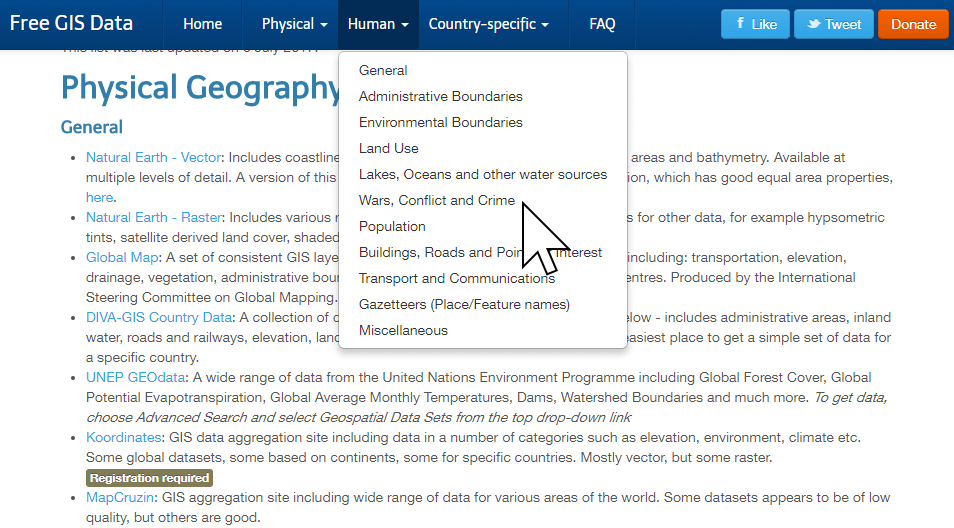
Robin Wilson’s ultimate list of lists. This is almost a one stop shop! Neatly categorised into physical, human, and country specific data, Robin’s list is a veritable orchard of juicy data for your Mango maps.
Find it at http://freegisdata.rtwilson.com
DIVA GIS
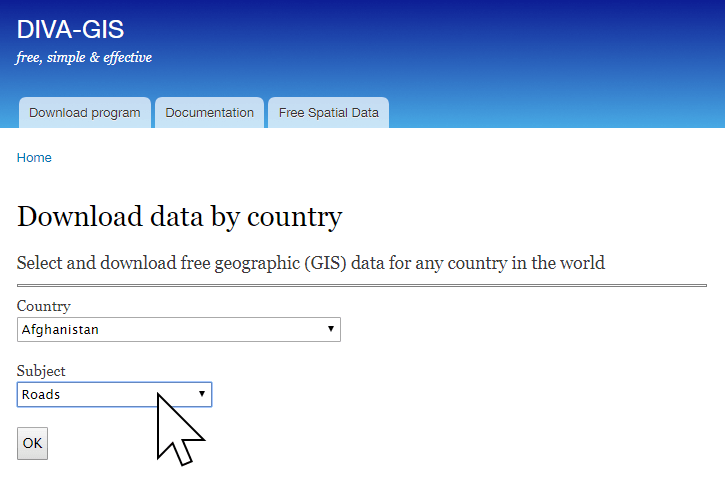
From the makers of DIVA GIS, a clear, simple data portal. Type in your desired country, choose your subject, click download. It’s really that simple.
Get your fill at http://diva-gis.org/Data
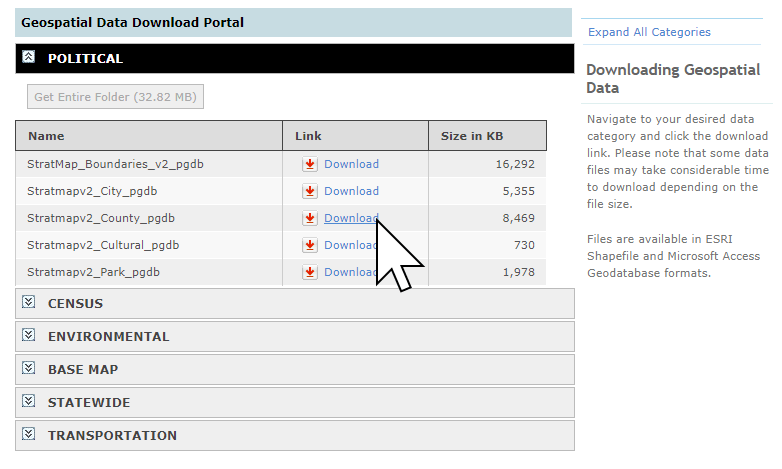
The Stanford Geospatial Center
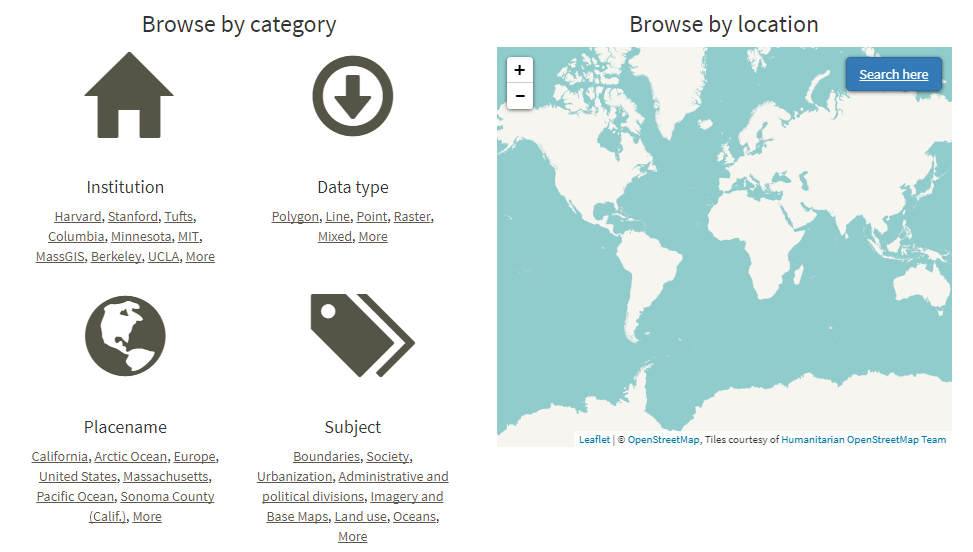
The Stanford Geospatial Center’s comprehensive list of data sources, arranged by region.
The data portal can be found at https://earthworks.stanford.edu
Preparing GIS Data
Let’s just jump in and take a look at the most common data preparation tasks:
Table Joins
So, here’s the scenario: You have a spreadsheet that contains your data listed by zip code, and you would like to build a quantity map to visualize the distribution of the sales.
To do this you are going to need to find zip code map data and then join your spreadsheet to the map data so that it can be used in a GIS.
So first you go and find the data by Googling “Shapefile US zip codes”.
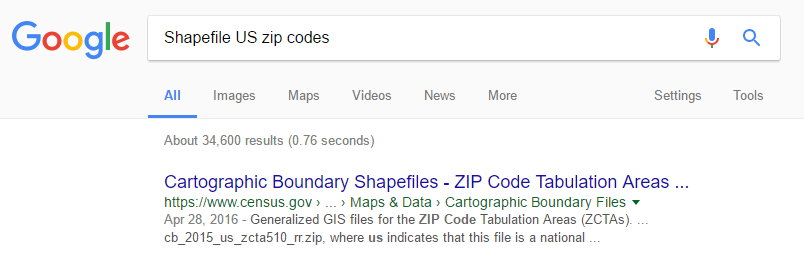
Find data to perform a table join
Once you have sourced the data you would open it in your desktop GIS and use the table join features to merge the datasets.
The table join works by choosing a column from the map data and the spreadsheet that contain shared unique values; e.g. the zip code.
The GIS system will then find all records that match and join them together by appending the columns from your spreadsheet to the end of the attributes for the map data.
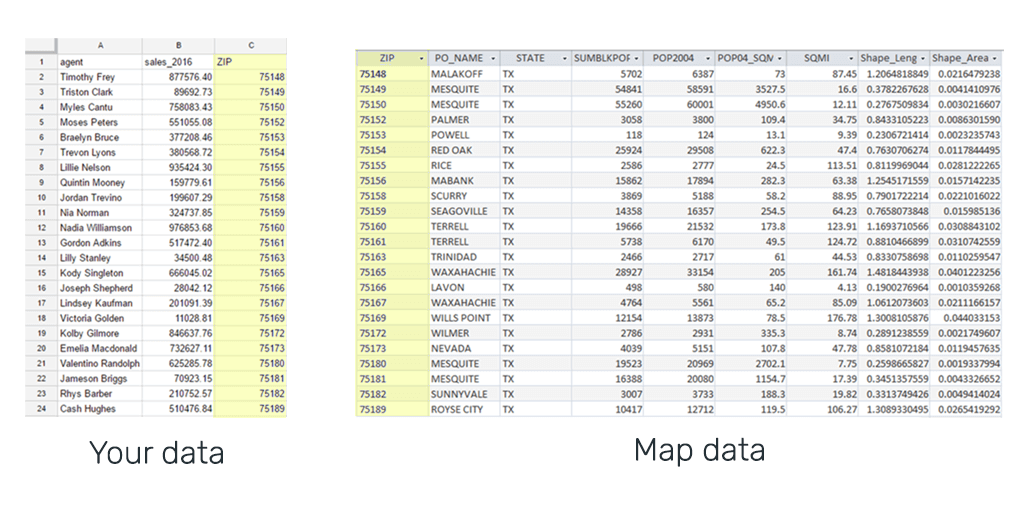
Joining spreadsheet data with geospatial data
Learn how to join spreadsheet data containing regions, state names, zip codes, or other unique features with existing spatial data with this step by step tutorial.
Geocoding Addresses
This is the most common scenario for organizations looking to map business intelligence data, where the data contains addresses.
The process of transforming an address into a coordinate is called geocoding, and is offered by most desktop GIS systems.
It works by passing the address to a geocoding service that stores data about the exact location of addresses.
The geocoder outputs a Shapefile that contains your spreadsheet data in the form of attributes and the lat/lon coordinates that can be plotted on as points on the map for each record in the new dataset.
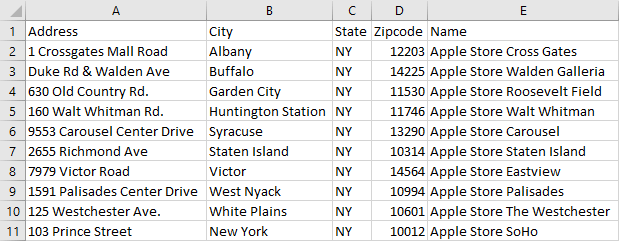
Address data in a spreadsheet ready to be geocoded into lat lon coordinates.
Learn how to create a web map from a list of addresses in a spreadsheet in this step by step tutorial.
Filtering a dataset
Often when we find third party map data, we end up with way more that we need.
For example, a county map of the US should contain all 3,142 counties and county-equivalent areas, however, you might only need one state’s counties, or just a few select counties.
You could join your data with the whole dataset, but then you’ve got a of distracting data that will be rendered on the map.
Instead, trim the fat, and filter out the unwanted data with a desktop GIS so you’re only dealing with your areas of interest.
It’s cleaner, and it’s simpler than you might think.
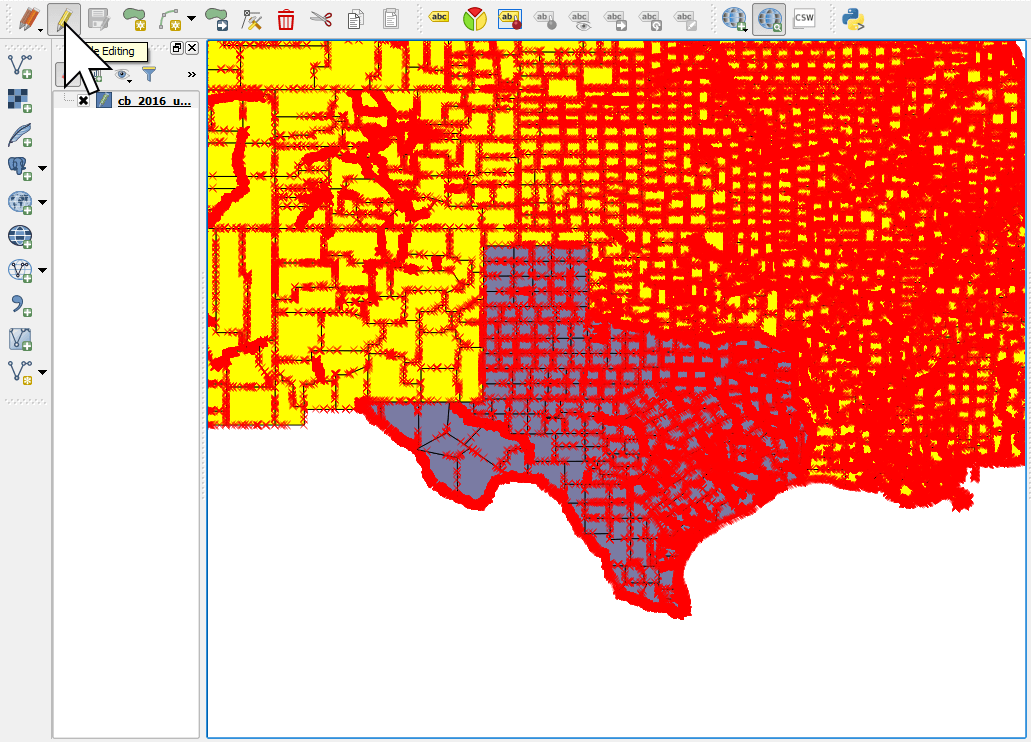
Filtering datasets in QGIS to remove unwanted data
Learn how to filter your data to delete unwanted areas with this step by step tutorial.
Calculating points in a region to create quantity heat maps
Often you’ll have two spatial datasets that reveal an interesting insight, something that’s not an attribute of either, but you’d like to visualize that.
Take a map of US counties, and overlay a point map of all the colleges across the US. We can see there’s a concentration of colleges in a few counties on the east and west coasts, but how many?
Neither dataset has that recorded as an attribute.
With a desktop GIS, we can not only calculate how many colleges there are per county, but in the process we can also create a new field in the data of the count, and use that new attribute to make more interesting maps.
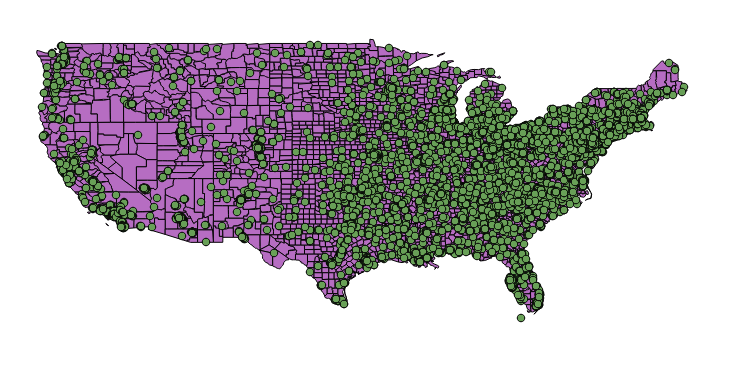
Desktop GIS makes it simple to create new data from two or more existing datasets