
So you’ve sourced the perfect shapefile covering US Counties with demographic and population data, and some neat geographic information like the square mile area of land and water for each county. Now, you’re ready to make a web map of sales data for Texas or add the data to your online GIS.
Problem is, like most map data sourced from third parties, this Shapefile contains features and information outside of your area of interest - in fact, it contains geometry and attributes for every single US county.
If you’ve ever downloaded a shapefile from the US Census Bureau’s website, you’ll find this is a common problem.
Short of making a strange map with lots of plain colored areas and then some nice shaded Texan counties, what can we do to trim the fat, so to speak, and filter out all the information we don’t need while keeping all the good data we do need?
The task here is to remove all of the features from the dataset that you don’t need.
In a GIS this is done by selecting our desired features using an expression or query, and deleting the rest.
“Features? Expressions? Queries?!!
I just want to map my sales data!”
I hear you.
Sounds like it’s going to be complicated, I know, but I’ll make this painless. You got this.
If you’ve found spatial data and are looking to filter out the unwanted data, I’m going to assume you know a little bit about mapping. After all, you found this tutorial, so you’re on third base and the home stretch is in sight.
So: Expressions. An expression in GIS is much like a formula in Excel.
Just like we could select a range in Excel with a simple =A1:A10, in a GIS we can create an expression to select a subset of features.
For example, we can isolate the unwanted areas in our US County Shapefile with a simple expression:
“STATE” IS NOT ‘Texas’
In QGIS, this expression would create a selection of all counties in the dataset, except for those with a STATE attribute value of Texas. Once selected, removing them is as simple as hitting the delete key.
Let’s walk through it.
In this tutorial, we’ll cover the following:
1. Importing the spatial data into QGIS
2. Creating a selection to delete information outside our area of interest
3. Exporting the filtered data as a Shapefile
The Data
For those that don't have any data, but want to play along at home, we've prepared a sample Shapefile of US Counties for you to work wth.
The data is in Shapefile format which is the de facto standard for sharing map data or publishing your data to a web map or online GIS. Despite its singular name, it is in fact a collection of files – with a minimum of four key files: (.shp, .shx, .dbf, .prj).
If you have your own spatial data in a Shapefile, just substitute the field references in the tutorial for the unwanted data you have.
If you have a your own data in a spreadsheet, you can follow this tutorial that explains how to convert a spreadsheet into a Shapefile.
You can easily find Shapefiles for different administrative boundaries for free online. For example, the administrative boundaries for the U.S can be downloaded from the Census Bureau.
The Tools
We will be filtering the data using a popular open source desktop GIS (geographic information system) program called QGIS. If you don’t already have QGIS, download it now, and install it on your system. It’s completely free, and is a great platform to continue learning about mapping and GIS.
Don’t worry, you don’t need to be a GIS wizard to complete this tutorial. However, if you would like to learn more about it, then here is a great place to get started.
For this tutorial, we’re using QGIS 2.18, but it should also work much the same on earlier and newer versions.
Let's get started!
1. Import the spatial data to QGIS
To create a selection with an expression, first open your dataset in QGIS.
1. Open QGIS
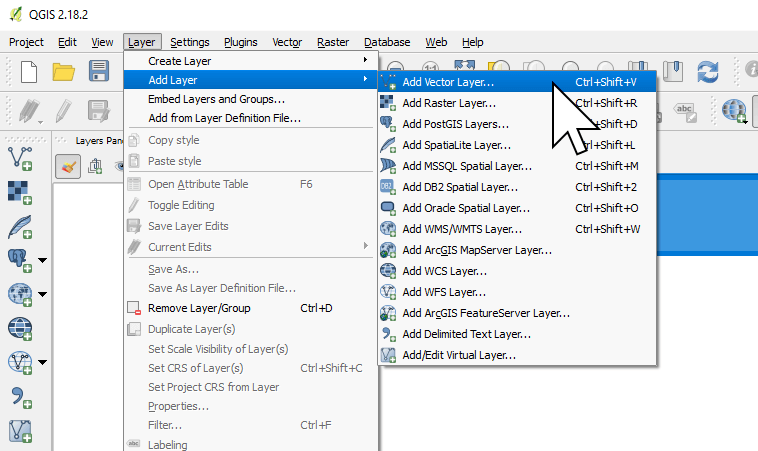
2. From the menu bar choose Layer → Add Layer → Add Vector Layer
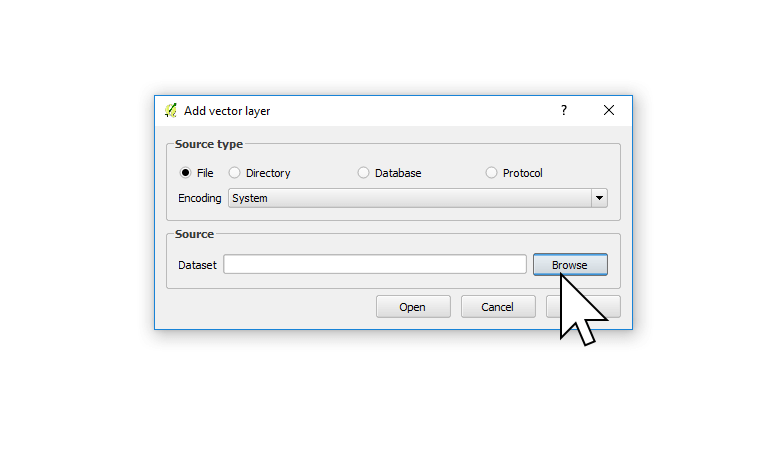
3. Navigate to your shapefile and add the dataset by selecting the .shp component of the dataset.
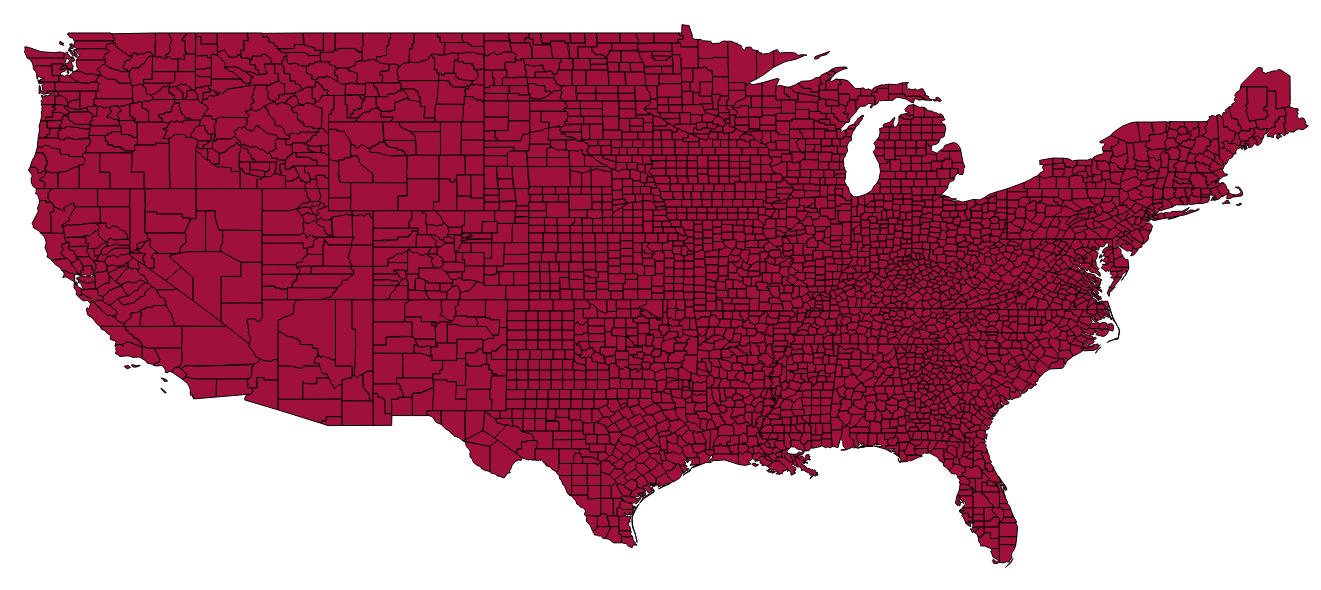
You’ll see your data appear as a plain map of counties.
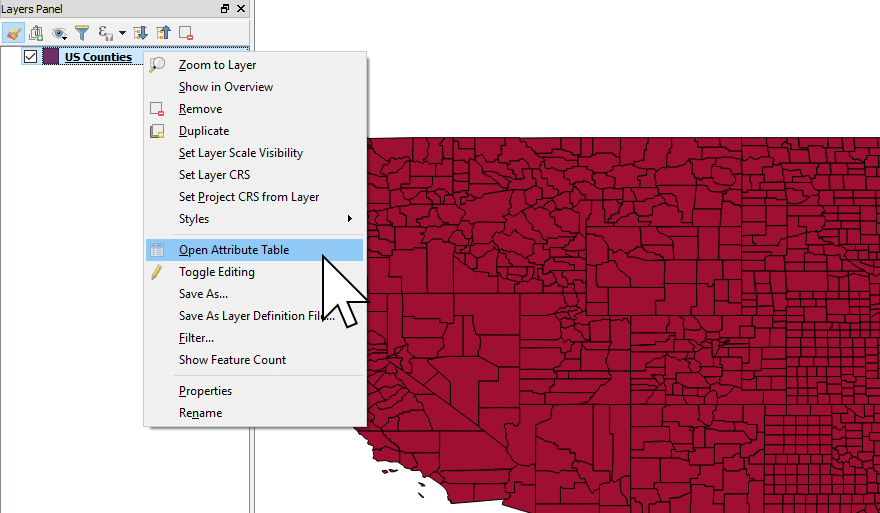
4. To understand what attributes are available to us to create an expression, let’s open up the Attribute table and take a look at what’s inside.
Right click on the US Counties in the Layers Panel and select Open Attribute Table.
Here we can see that there is series of columns, and lots of rows - 3,109 rows - one row for each County in the contiguous US. Each of these rows represents the county polygons you see on the map.
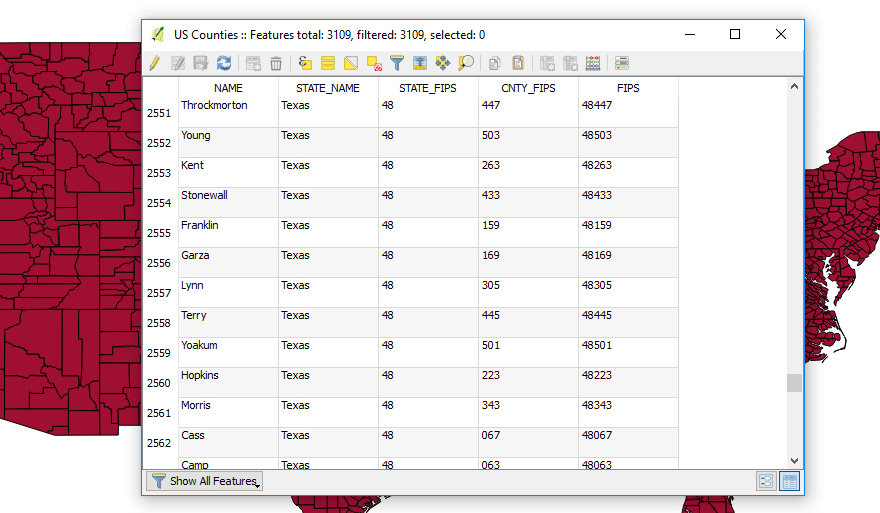
The columns we have - which are the attribute fields for each county, are:
- NAME - the county name;
- STATE_NAME - the State the county is in;
- STATE_FIPS - the adminstrative code for the state;
- CNTY_FIPS - the administrative code for the county, and;
- FIPS - which is simply state and fips code combined into one unique number.
To create our filter with an expression, we need one attribute that will be consistent across all the counties we want to keep. In this case, we have state names, so we can simply use “Texas” in our filter. If you only had a State FIPS code, you could use that instead.
We’re now ready to create our Selection.
2. Creating a selection to delete information outside our area of interest
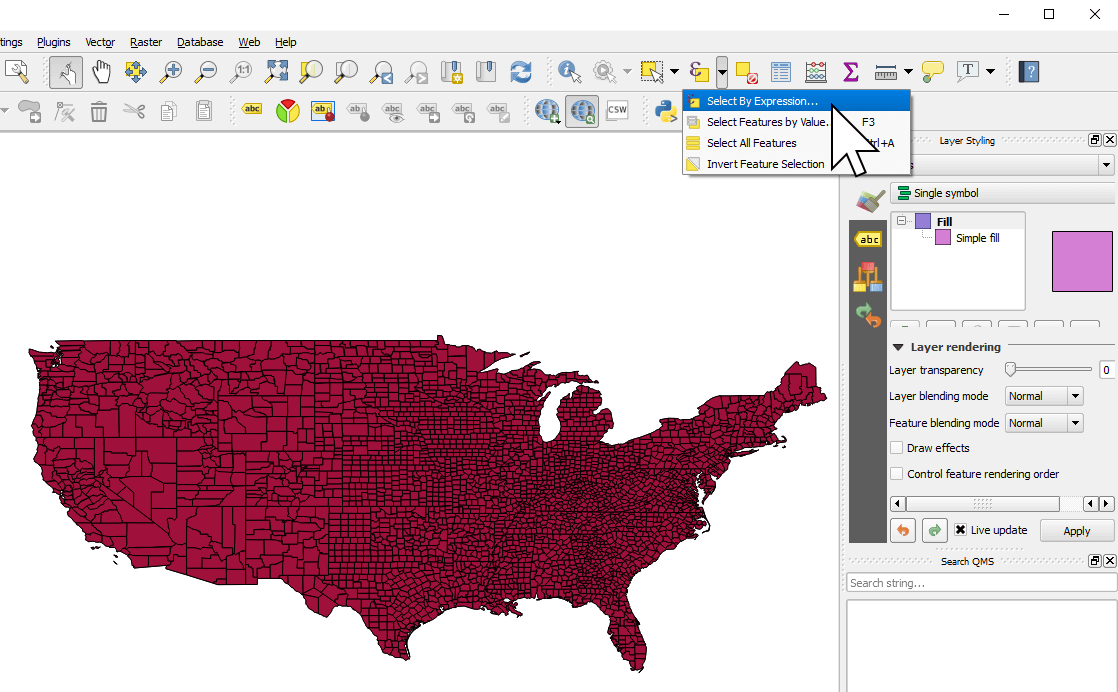
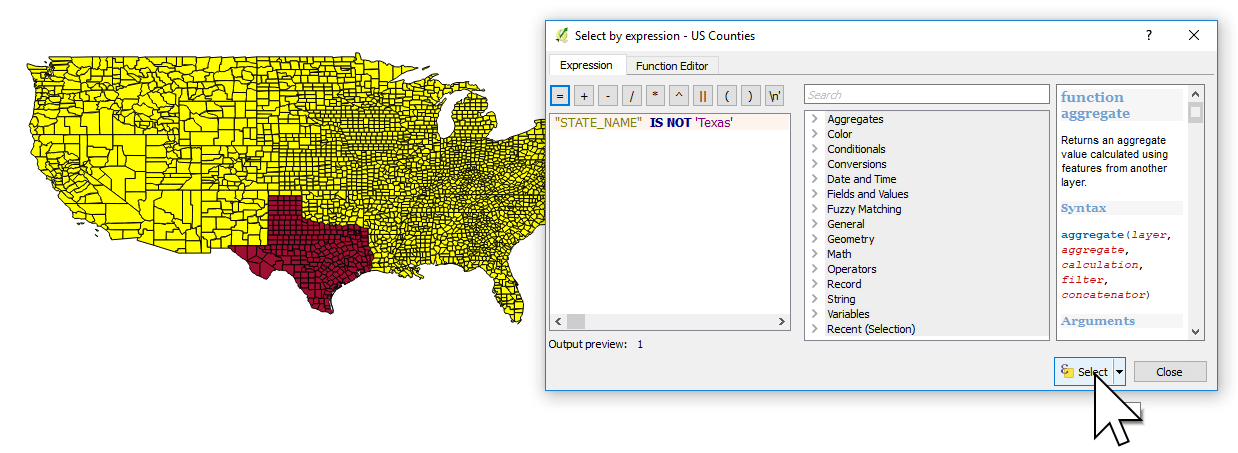
1. From the toolbar at the top, click on the expression icon and choose Select By Expression…
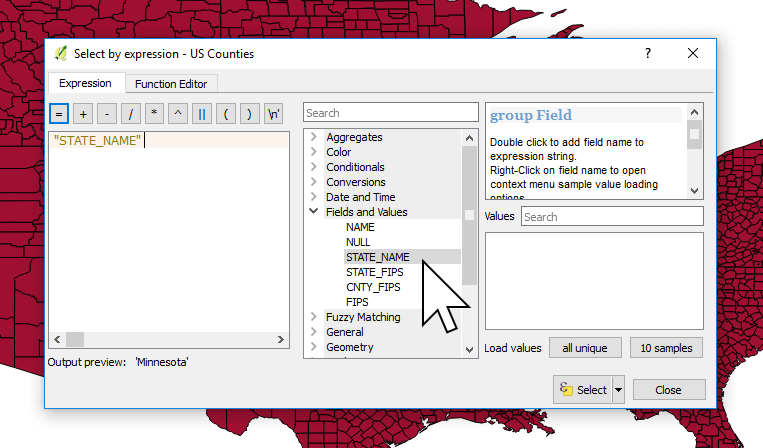
2. In the expressions list, click on Fields and Values, then double click on the field that contains our consisten attribute of Texas: STATE_NAME. You should see “STATE_NAME” appear in the expression editor on the left.
3. Now, click in the expression editor and type: IS NOT 'Texas'
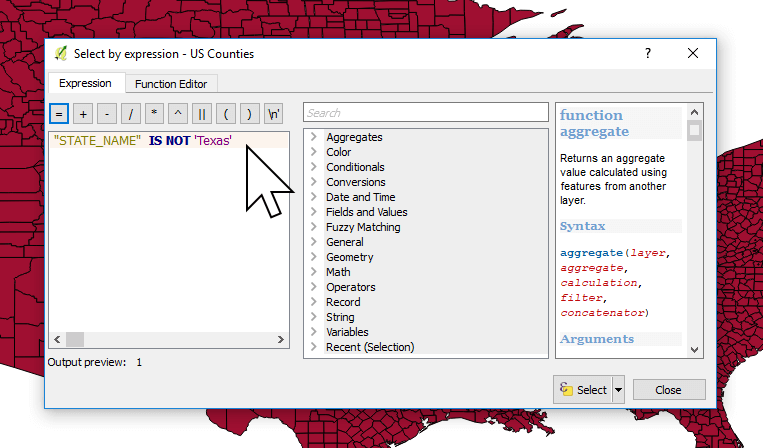
4. Click Select, and you’ll see all counties in states that aren’t Texas will be highlighted yellow.
Close the Select by expression window.
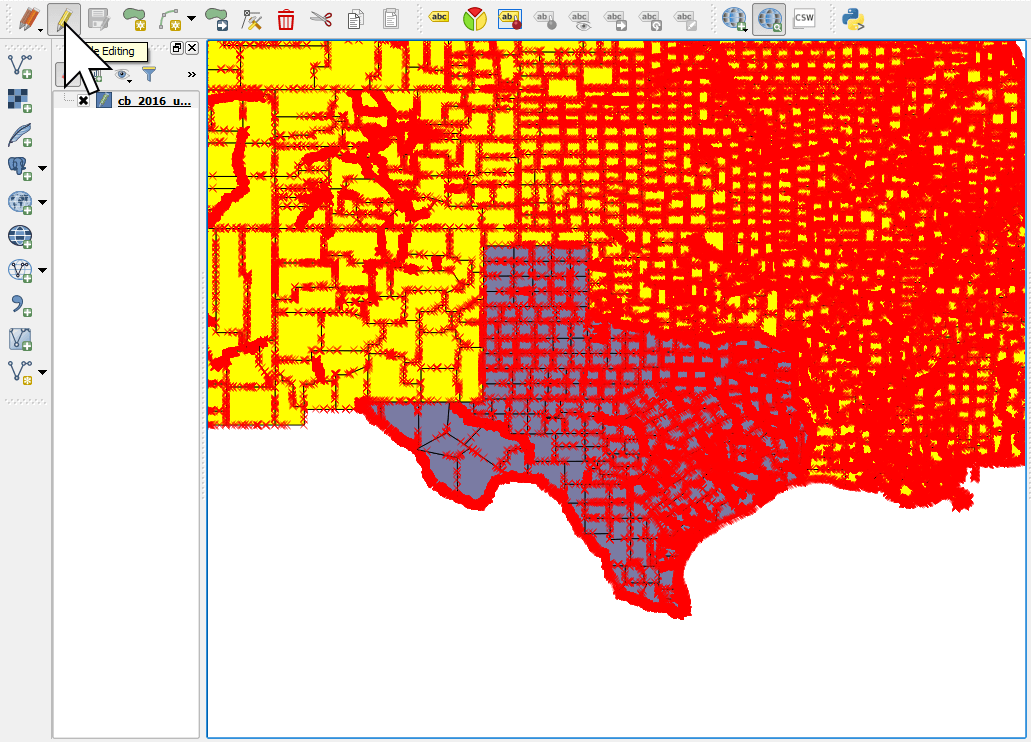
5. Now, toggle layer editing by clicking on the pen icon on the toolbar. In edit mode, you will see that all features will have red node markers.
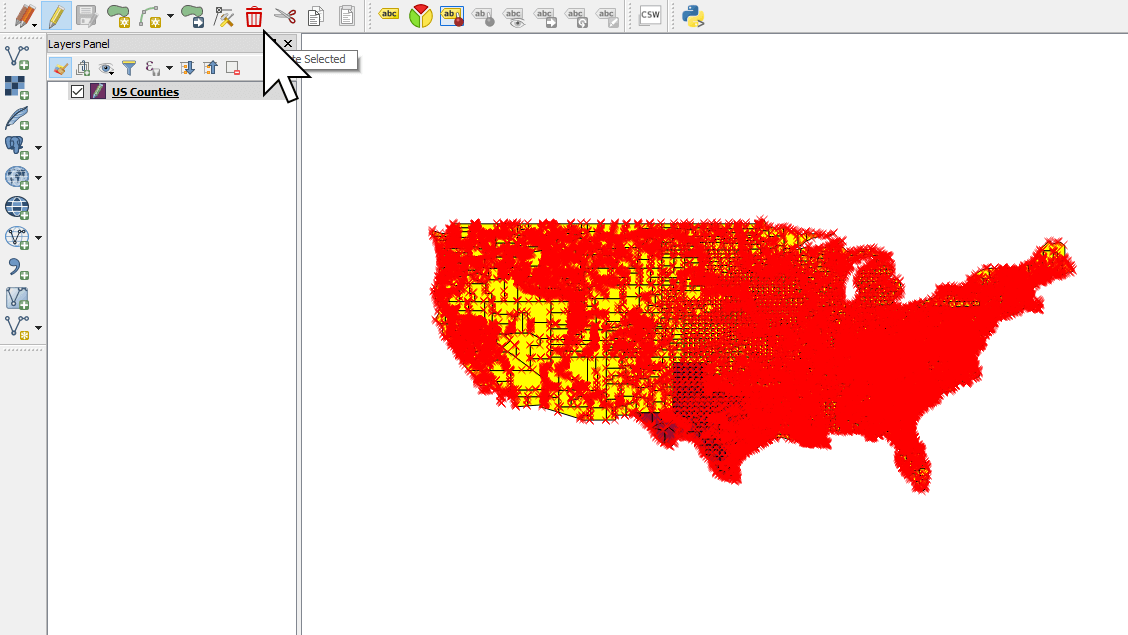
6. Click on the red trash icon on the toolbar to delete the unwanted counties in the selection in one fell swoop.
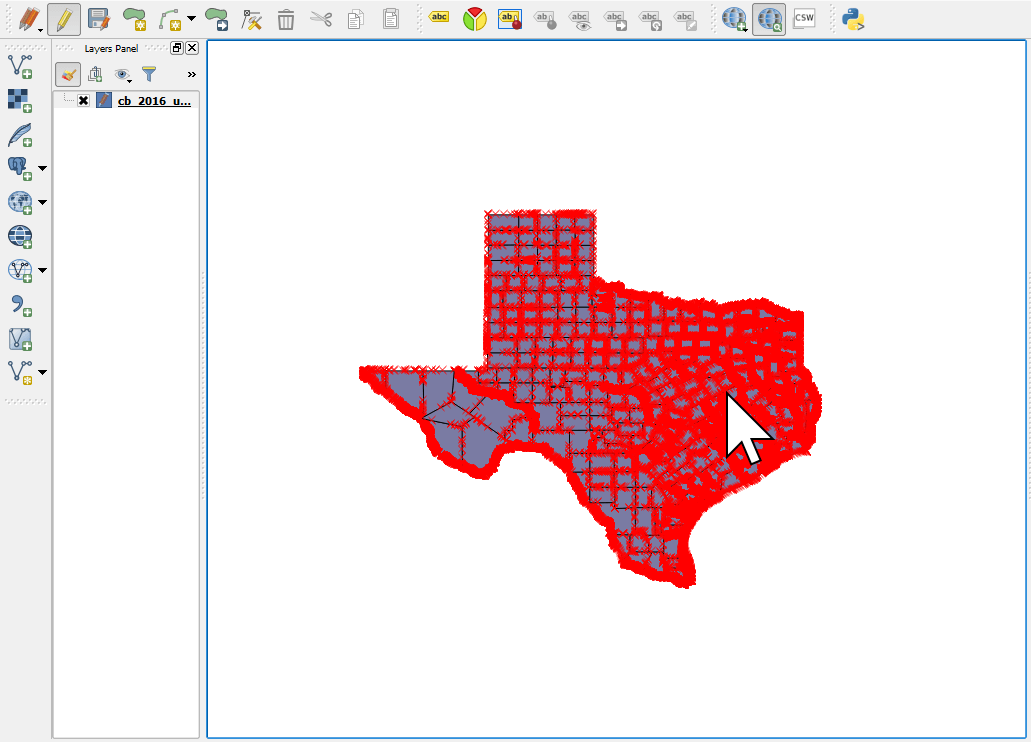
7. Now we should be left with only Texas counties. Nice.
8. Exit edit mode by clicking on the pen icon again.
3. Export your data to Shapefile
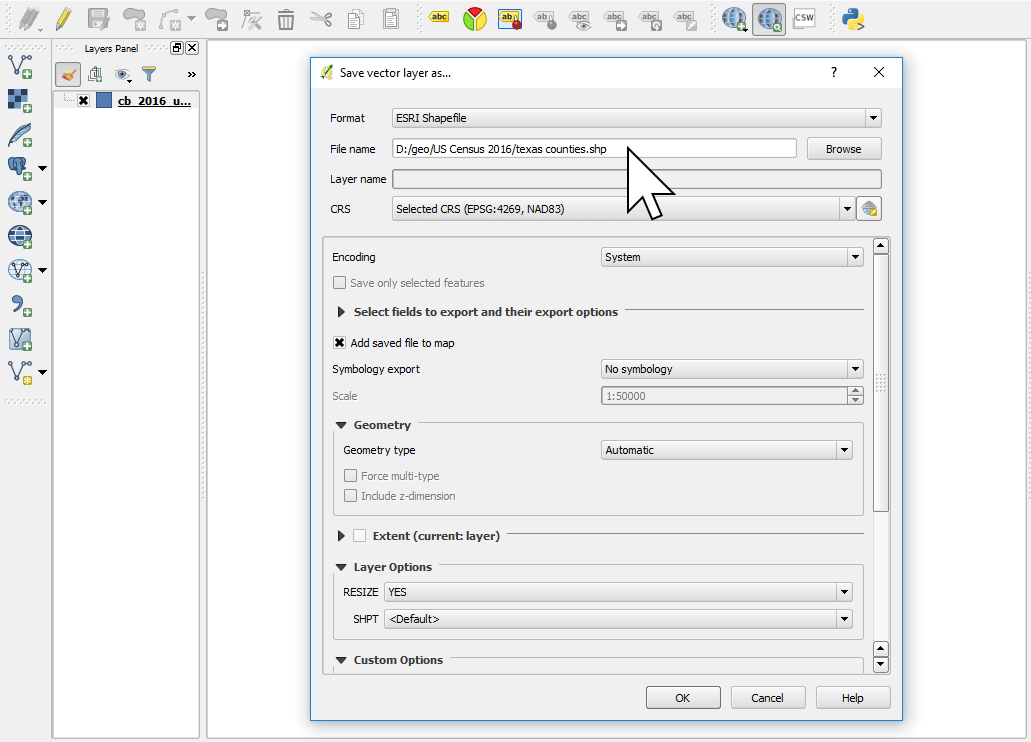
1. Right click on your layer in the legend and select Save As...
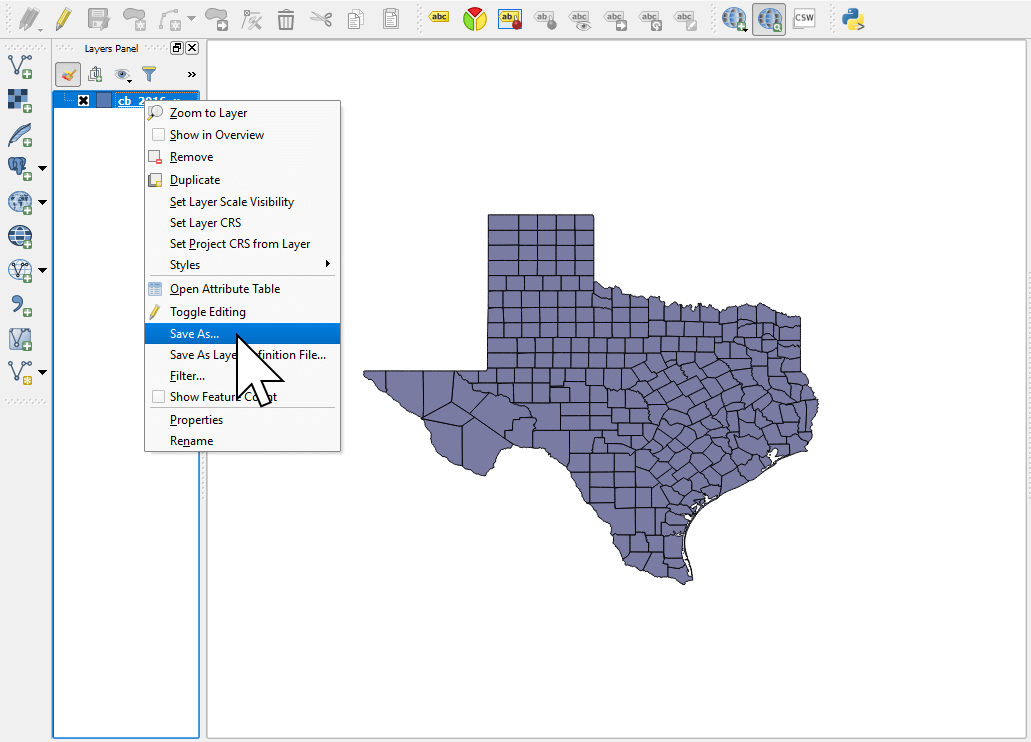
2. Name your new dataset, and click OK.
And that’s it!
You’ve removed unwanted data from your spatial file of US Counties, and now you have a shapefile containing only your area of interest. Good work!
Next, you could join your Texas county shapes with address data from a spreadsheet, or you could upload this dataset to Mango.