With so many GIS software solutions available on the market, how do we even begin choosing which one to use? In this chapter we will give you the background knowledge that you need in order to answer that questions for yourself.
For those of you that have tried looking for GIS software for the first time, there’s one thing that you will know for sure: you aren’t short of choices.
So I guess the first thing you want to know is which one is best? The answer is…
There is no answer.
It’s best to think of GIS software like tools in a toolbox, you don’t want to use a screwdriver to bang in a nail. Often GIS solutions will involve a “software stack”.
This means we use several tool in unison. For example, we use a desktop GIS system for creating and modifying our GIS data, then once the data is ready we upload it to a web GIS system in order to distribute the maps within our organization.
Types of GIS Software
Choosing the right GIS tool is really about understanding the problems that you are looking solve. Most GIS software falls into one of the four categories below
Desktop GIS
Desktop GIS platforms are the swiss army knives of GIS. They are used for creating, editing, visualizing, managing, and analyzing geographic data.
Desktop GIS systems are complex programs. As with tools such as Photoshop or Microsoft Excel, most users can figure out the basics pretty quickly, but becoming a true master can take years.
The best way to go about learning a desktop GIS system is through a problem/solution approach. So rather than trying to learn everything it’s capable of, it’s best start with figuring out the parts that are applicable to the problems you want to solve.
As I mentioned in a previous chapter, for most GIS beginners those problems are:
- Creating visualizations, category maps / quantity maps / heat maps etc
- Performing queries and visualizing the results
- Joining spreadsheets with map data
- Geocoding addresses
- Editing feature geometry
- Editing feature attribute data
Desktop GIS systems are capable of a whole lot more, but these topics are usually a good starting point.
Later in this chapter we will take a look at the most popular desktop GIS systems, ranging from free and open source solutions to expensive paid products.
Web GIS
Like all forms of information distribution, the internet has completely revolutionized GIS.

In a time before web based GIS systems, when you wanted the answer to a location related question or to view a specific visualization, you would contact the GIS team and ask them to prepare a map for you.
Once the map was ready you would take a walk over to the GIS department to view the map on a workstation or collect a print out.
With the latest generation of super easy to use web GIS systems, all that has changed. Web GIS gives non-expert GIS users the ability to easily interact with map visualizations and answer their own questions without having to involve a GIS team.
What’s more they can answer those questions from anywhere, anytime, using any web accessible device.
Web GIS systems used to be very expensive to develop, deploy and maintain. A typical deployment would require programmers, servers and system administrators.
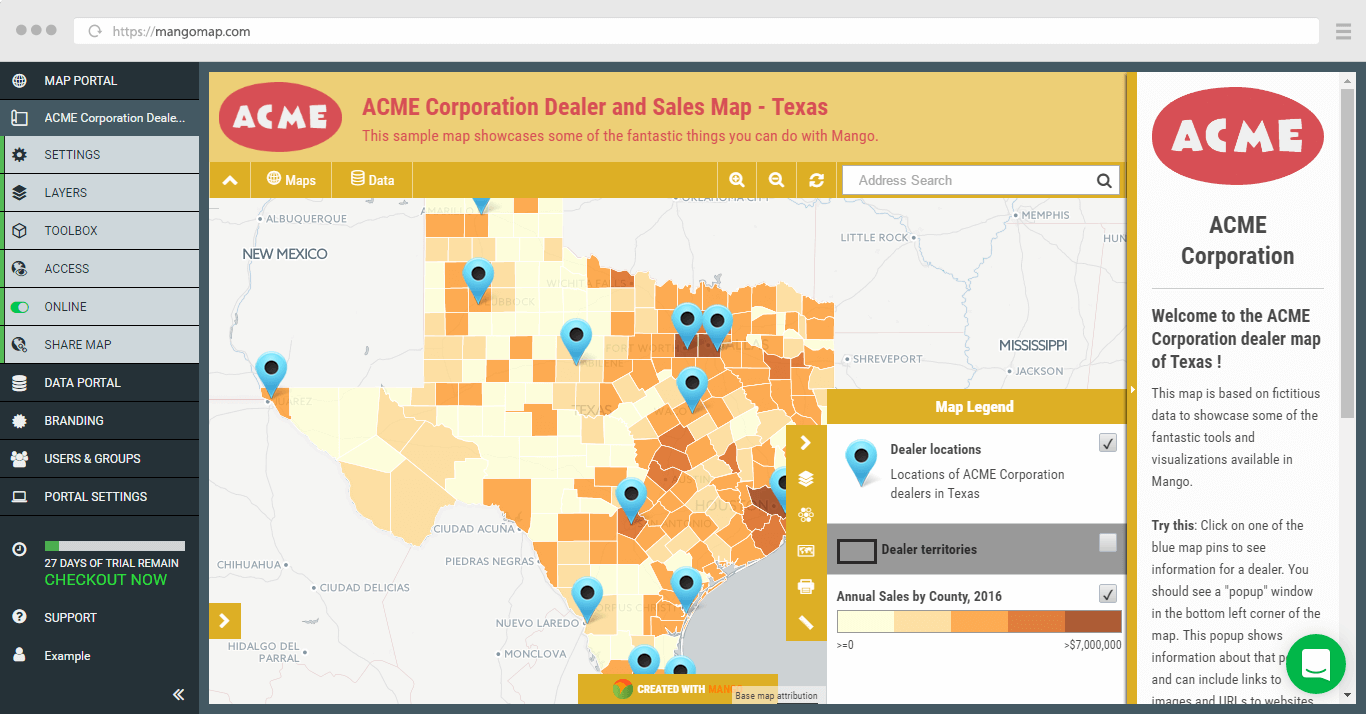
But now thanks to cloud based services such as Mango these barriers to entry have been removed.
Now web maps can be created for a very low cost, using a point and click interface in a matter of minutes using nothing more than a web browser!
The next chapter is devoted exclusively to web GIS. We will be going into much more detail regarding the benefits of web GIS.
Server GIS
If a web GIS has the lowest barrier to entry, then a server GIS definitely has the highest, with by far the steepest learning curve.
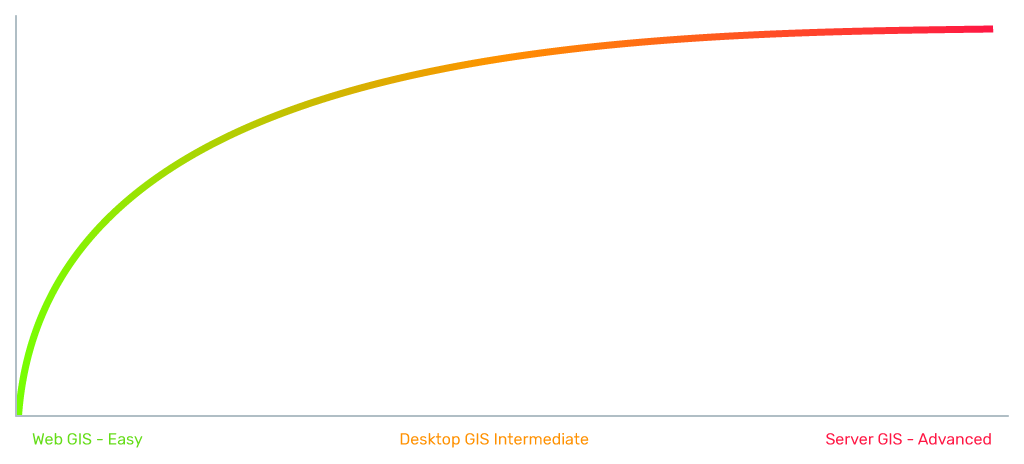
As you are new to GIS you likely won’t need to concern yourself with server based GIS solutions. Generally they are only used for large scale mapping efforts and very specific niche tasks.
The most common server GIS system is a spatial database.
A spatial database is used as an alternative to the file formats discussed earlier. They are commonly used in cases where the dataset is extremely large, or in scenarios where numerous people need to access and edit the data at the same time, possibly from different locations.
Specialized GIS
As with server GIS systems, specialized and niche GIS systems are not something you need to concern yourself with in the beginning.
These products tend to perform very specialized tasks. There are really too many use cases to list so I will just give you a couple of interesting examples just to show you how diverse this sector is.
Image Classification
Image Classification is a specialized GIS application whereby pictures of the earth are turned into meaningful map data e.g. land use types or classes. These pictures or images are captured digitally and separated into different spectral bands including the visible spectrum (Red-Green-Blue) and others such as infra-red. Based on the spectral information stored for each pixel, we can perform analysis known as classification to assign a pixel to a class based on its similarity to reference pixels. The process of “images to information” makes it easier for professionals and decision makers to understand patterns in the natural world as well as change over time.
Lidar
Lidar data is best understood as a “point cloud” of the world outside, whether that’s a tropical rainforest or a highway interchange. Modern Lidar systems are capable of modeling the real world with a very high point density with thousands of points per square meter.
As you might expect, making sense of the is information is a monumental task requiring some serious processing power and sophisticated routines. The best of these are capable of being trained to automatically identify features based on size shape and also to identify ground level, with all above-ground features removed.
Getting Started with Desktop GIS
Now that we covered briefly the various types of GIS software available, the next few chapters will zero in on the types of GIS software that you, as a beginner you are most likely to need. Namely; desktop GIS and web GIS.
Later in this chapter we will take a look at the most popular GIS desktop platforms and what differentiates them, but before do that we are going to look at the features and functions that they all have in common before we move onto web GIS.
Desktop GIS: The Basics
As a beginner your decision over which desktop GIS software to use likely won’t be driven by functionality. All desktop GIS systems have the same core functionality which is usually more than enough for the requirements of new GIS users.
So let’s take a look at what those commons functions are.
Adding Layers
Most maps are made up of multiple layers stacked up on top of each other. In the legend the name of each layer will be displayed alongside a checkbox that can be used to hide and display the layer.
Also the legend will contain a graphic that let’s us know what the colors, fills and strokes on the map represent.
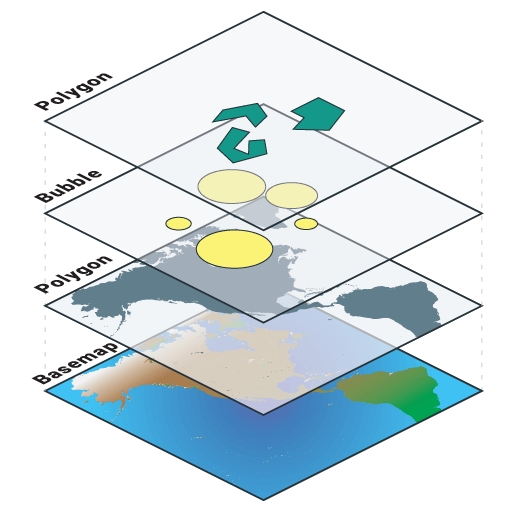
Sometime those layers are all using different datasets, but it’s also possible for multiple layers within the map to be using the same dataset.
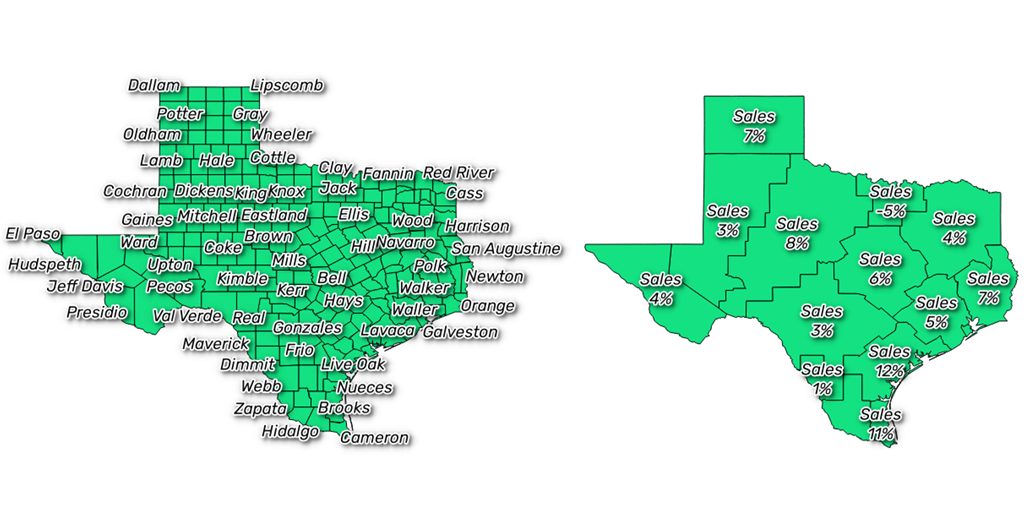
For instance you might have one quantity layer that shows this year's sales by county and another showing last year's sales.
Both layers could be using the same dataset as it contains attribute columns for both this year and last year.
Stacking layers like this is interesting because it allows us to make comparisons. By putting this year's sale data above last year's in the stack, we can turn this year's sales layer on an off in order to make a quick comparison and visualize any changes.
Styling Layers
Desktop GIS systems usually give you very fine grained control over the appearance of the layer.
You can use category and quantity class breaks as we covered earlier, but you can also do a lot more. The three things that you can visually style are the stroke, fill and labels of a feature.
-
Stroke
The stroke is used for lines, or the outlines of points or polygons. You can control the color, thickness, transparency and style of the lines. You can also stack various line styles on top of each other to create some interesting composite styles.
Line stroke styles 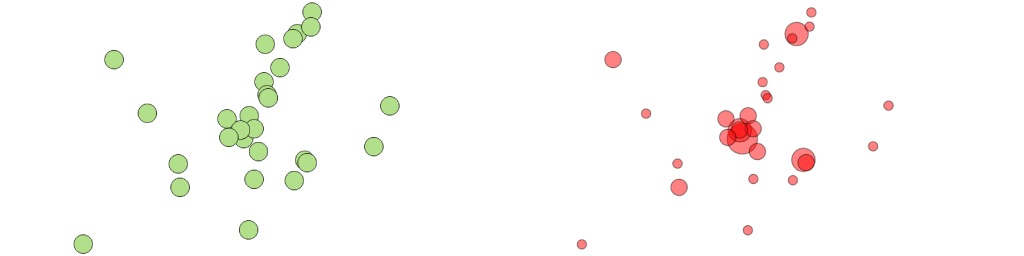
Point stroke styles 
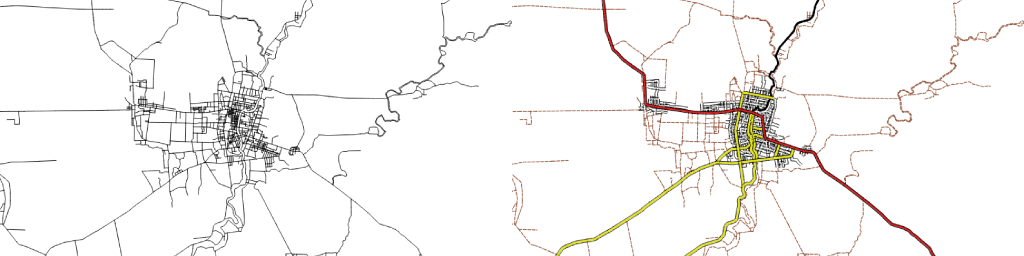
Polygon stroke styles The strokes can also be modified based on the attribute data. For example if we had a layer called “Roads” and the data had an attribute column called
typewhich is eitherHighway,Major Road,Minor Road,Residential RoadorTrackwe could tell the GIS to render a different style based on the type value.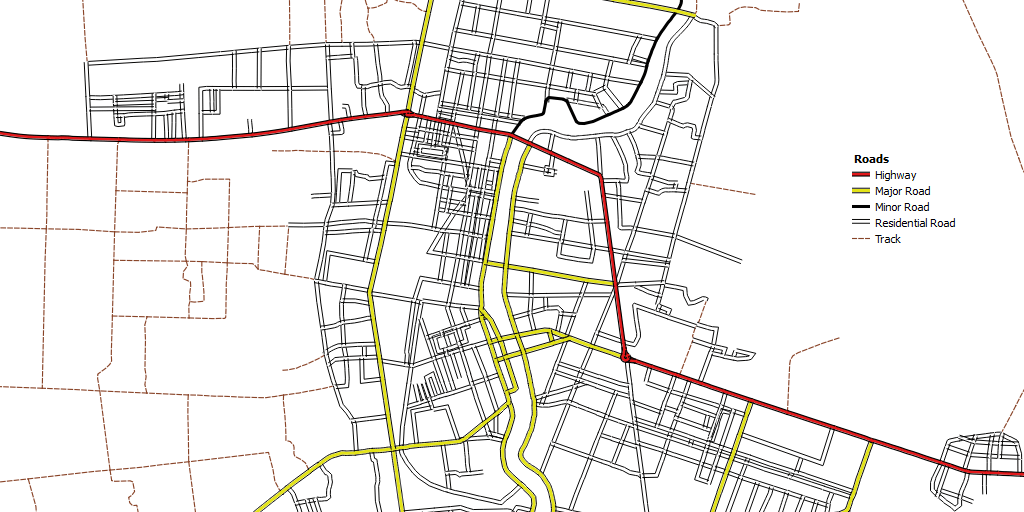
Varied stroke styles based on attribute data -
Fill
A fill can be used for either a polygon or the center of a point. You can control the color, style and transparency of the fill and as with the stroke it can be changed based on an attribute value in the data.
Fill styles are particularly interesting as they often allow you to communicate two pieces of information at the same time by stacking layers.
For example we might want to visualize our sales data by county for the previous year and also at the same time see which counties were targeted in our annual sales plan.
Isolating annual sales plan target areas to create a new layer To achieve this we can have a standard quantity layer to represent the sales data. We can then add a second layer that only displays the target counties and gives them a cross-hatched fill.
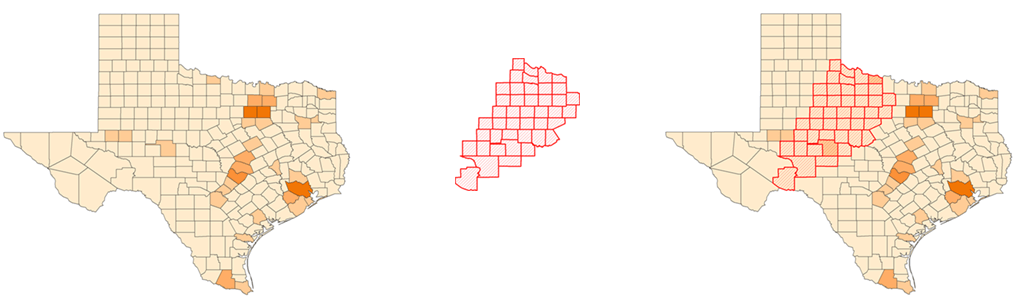
Layering annual sales data with annual sales plan target areas Now without needing to turn layers on and off we can visualize our sales data and our target counties at the same time.
Labels
Lines, points and polygons can all be labeled in a GIS. The label can be made up of one or more attributes from the feature that’s being labeled.
You can also modify the font, size, fill and outline of labels. An important consideration when styling labels is to make sure that they stand out from the map and can be easily read.
Creating Selection Sets
A selection set is a subset of features within a layer. Selection sets are used to visualize a particular group of features or to perform bulk operations such as aggregating, editing or deleting.
Selected features will be highlighted on the map.
A selection set can be created in a number of different way, using tools within the GIS:
-
Map Point and Click
This is the most straightforward. Just point and click on the features that you wish to add to the selection.
Clicking features to create a selection set in QGIS -
Table Point and Click
Layers in your map have what is know as a table view. The table view just presents the same data that’s displayed on the map, but as a table that looks similar to a spreadsheet.
From the table view it’s also usually possible to select features.
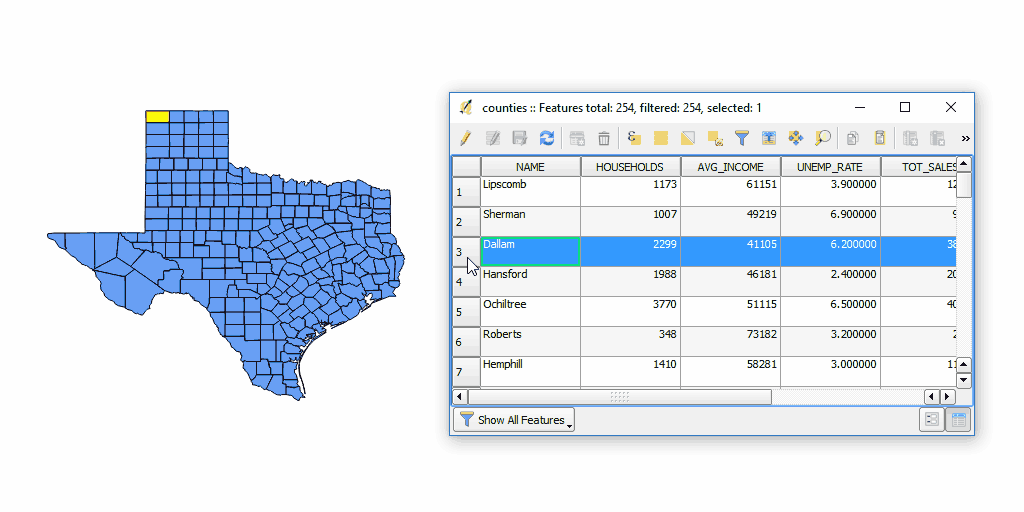
Selecting table rows to create a selection set in QGIS -
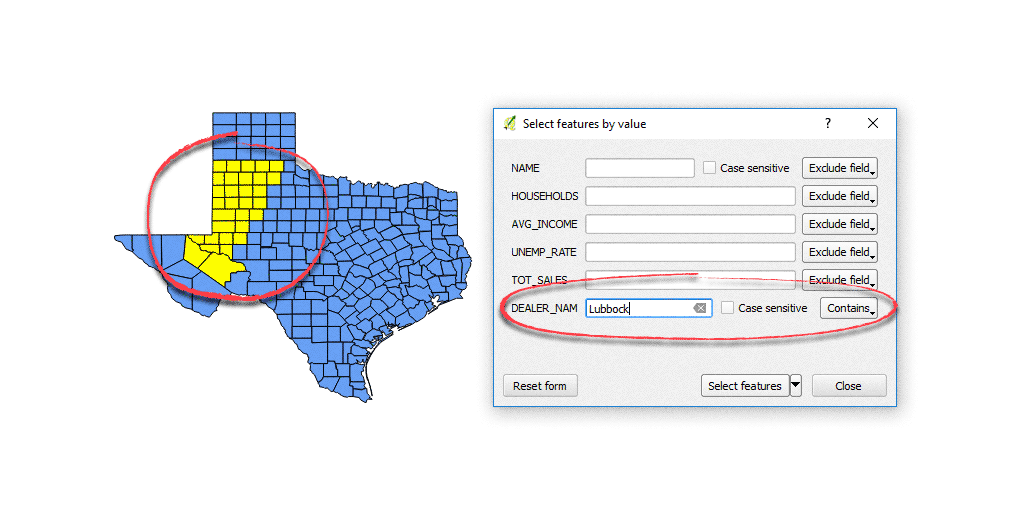
Attribute Query
Sometimes referred to as an expression. You can select features by building rules, e.g;
- Select counties where
“sales > $1,000,000” - Select roads where
“type IS ‘highway’”
Different desktop GIS systems have different ways of constructing these queries, with some using a syntax similar to Excel formulas and others using a graphical query builder. Either way the concept is the same.
- Select counties where
-
Spatial Queries
Now this is where things start to get really interesting, as this is functionality that you definitely can’t perform in a spreadsheet program.
A spatial query allows you to create rules that relate to the location of the feature in relation to others.
Spatial queries can be used to answer some very complex questions, such as:
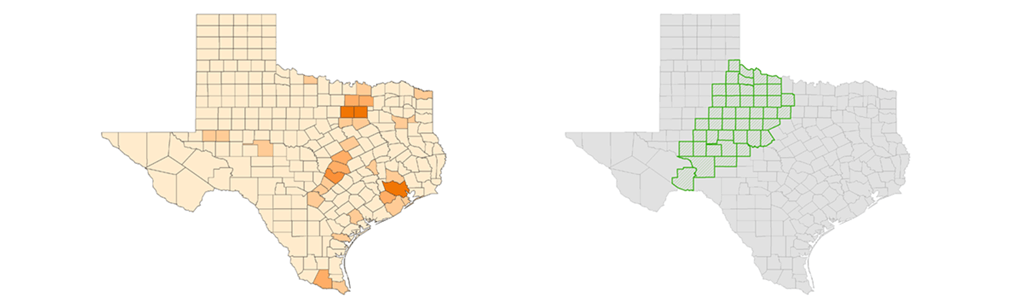
- Which distributors have overlapping sales territories?
- Which houses are within 500m of the 2010 flood area?
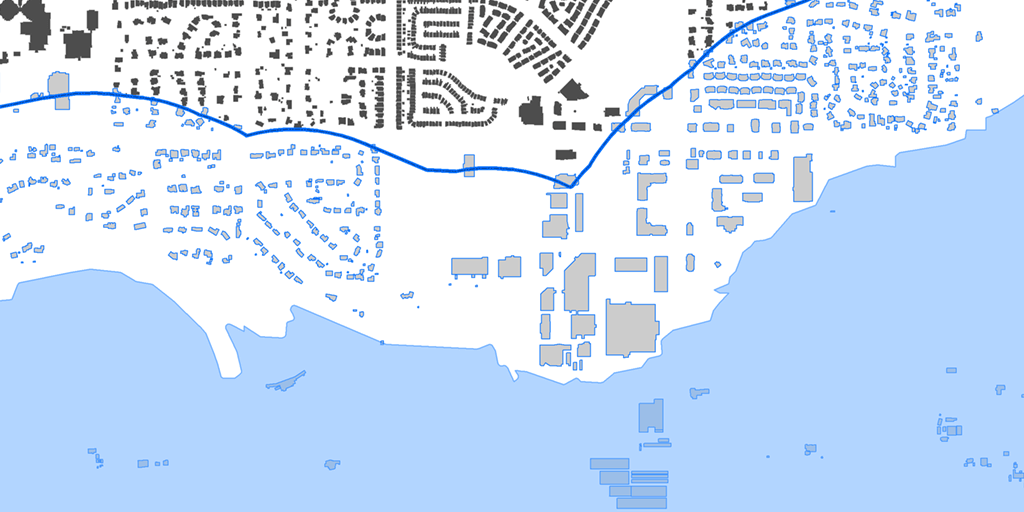
Flood query results highlighted in blue What’s more these spatial queries can be combined with attribute queries. For example:
- Select counties that don’t contain a dealership AND sales were above $1,000,000
- Select all properties within 10 miles of a store AND the property value is greater than $500k
These combined queries are extremely powerful. Within a few click we can get insights into location related patterns and trends that could take weeks to manually extract from a spreadsheet.
Working with Selection Sets
Once you have a selection set, what can you do with it?
- Extract the selected features to a new dataset
- Delete the features from the existing dataset
- Create a report that aggregates attributes from the selected features
- Bulk edit the attributes of the selection set
- Create a printout of the selection set
- Export the selected features to a spreadsheet
Editing and Managing Data
A GIS isn’t just somewhere to upload your data, it’s also a place to create and maintain your data.
A GIS allows you to add, edit and delete features. Editing the attribute data works in much the same way as a spreadsheet. You can edit feature attribute by either clicking on features from the map view or selecting features in the table view.
-
Editing Features
As with a spreadsheet, you can apply formatting rules, edit cells directly or even create whole new columns and populate them with values using formulas.
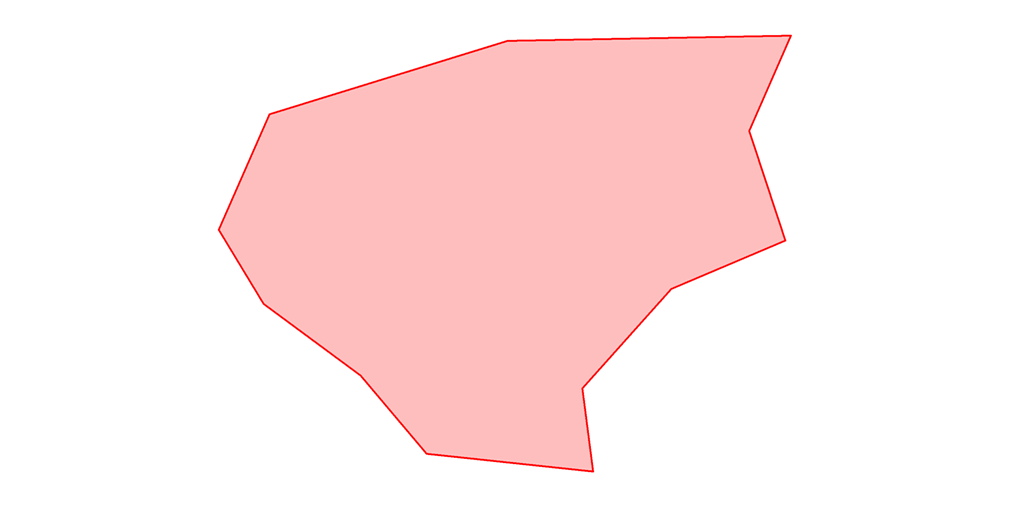
Unlike a spreadsheet however a GIS can be used to create edit and delete geometry. Points can have their positions changed and you can modify the shape of lines and polygons by clicking and dragging vertices.
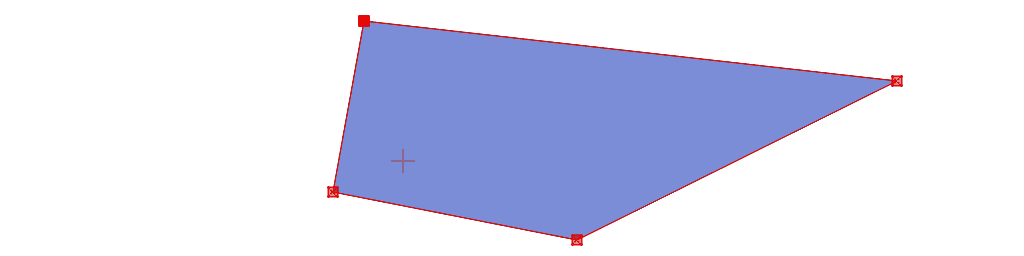
Editing a feature by dragging corner nodes Another common task is splitting and joining features within a layer. Joining features is usually just a case of selecting the adjoining features and then pressing a join button, while a split is achieved by drawing a line through an existing feature.
Splitting a feature by drawing a line 
Merging features There are lots of other tools within a GIS that can join and split data in a range of exotic ways, but they are outside of the scope of this introduction.
-
Creating New Features
To create features by hand we usually need a point of reference such as a satellite image that allows us to place a point or trace a line or polygon.
This process is known a digitization and is quite straight forward in a GIS.
Once we’ve added the geometry, the attribute data is usually added via an onscreen form.
Another way of adding geometry for a new feature is using a path that’s been recorded in a GPS and uploaded to your computer (usually in GPX format).
Popular Desktop GIS Software
The two most used desktop GIS programs by far are ArcGIS and QGIS. Both offer similar functionality but there are some major differences in terms of how they are distributed and their surrounding ecosystems.
ArcGIS for Desktop
ArcGIS for Desktop is produced by Esri who have been the market leaders in the GIS software industry since the beginning, and ArcGIS for Desktop — their flagship product — is the most well known and widely used of all GIS systems.
ArcGIS Desktop is usually purchased from a local distributor. The cost varies by region, but at the time of publication the most basic ArcGIS license is $1,500 in the USA.
Additional modules will incur additional costs, as will a maintenance contract which is required if you wish to receive software updates.
Support is provided either by local Esri distributors or online by Esri themselves via support forums.
There are different tiers of support and the response times will vary based on which tier you have subscribed to.
ArcGIS for Desktop is only available for Windows computers. There is no Mac on Linux versions available.
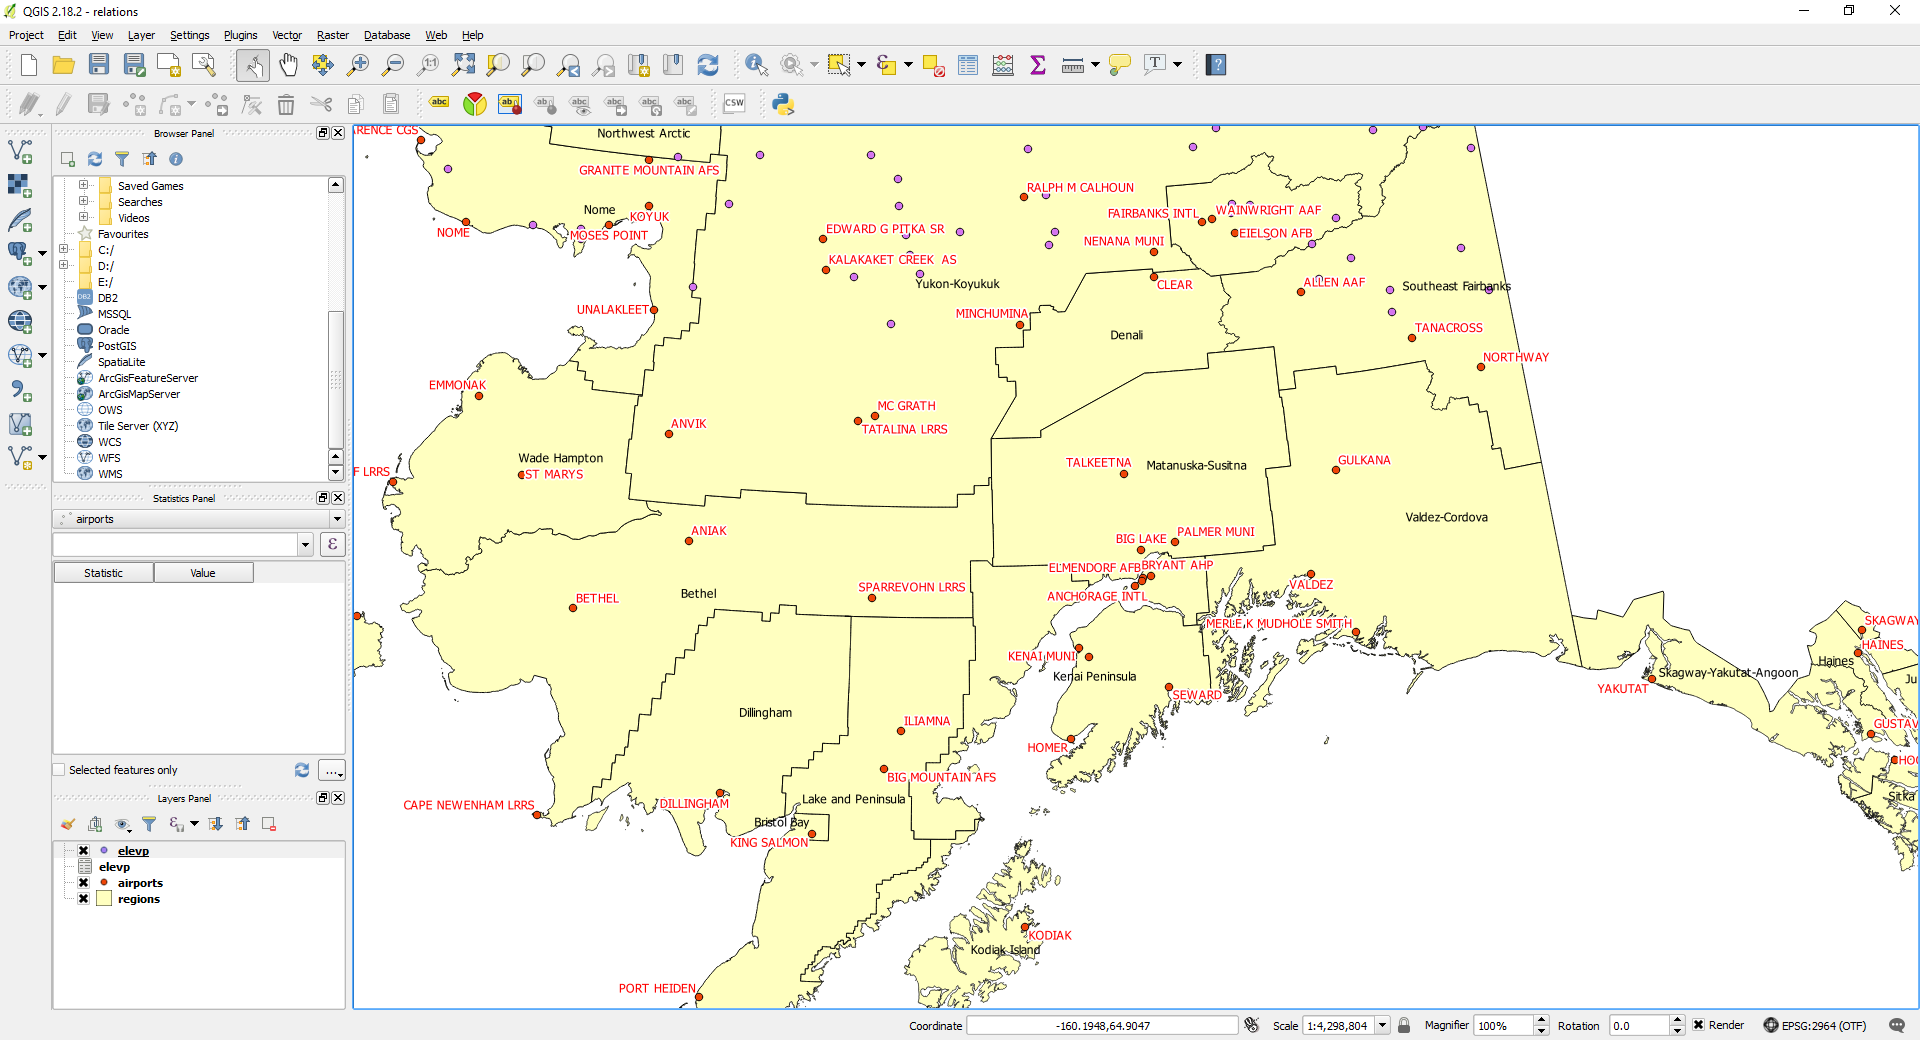
QGIS
Previously known as Quantum GIS, QGIS is a free and open-source desktop GIS system that’s been around since 2002.
QGIS is extremely popular, with a very large user base and a very active supporting community. It’s also open source, which means it can be downloaded and installed for free without restriction.
Being open-source means that it’s been developed by a community of developers rather than a company, and the license for the software ensures that it will always be free.
Another advantage it has over ArcGIS for Desktop is that it works on Windows, Mac or Linux systems.
Support is provided by the very active and very supportive community. In addition paid support packages are available from companies such as Boundless.
QGIS is the default choice for new GIS users, especially when the price differential is factored in.
At Mango we are QGIS users and strongly recommend QGIS as the first choice for all new desktop GIS users.
Later we will be devoting an entire chapter to QGIS in which we will show you how it can be used to perform the basic GIS tasks that we covered earlier in the chapter.
The Internet has totally changed the GIS world. It’s no longer just the preserve of the experts and enterprise. The best part? Using a Web GIS to create incredible data-rich web maps — that can be shared with anyone, anywhere, on any device — takes just minutes.