Now we understand what a GIS is and what is can do, the next step is to understand how a GIS is made. But first you need to take a crash course in GIS data.
If you think the term GIS is vague, then you haven’t seen anything yet. There are a dizzying array of formats used for storing GIS data.
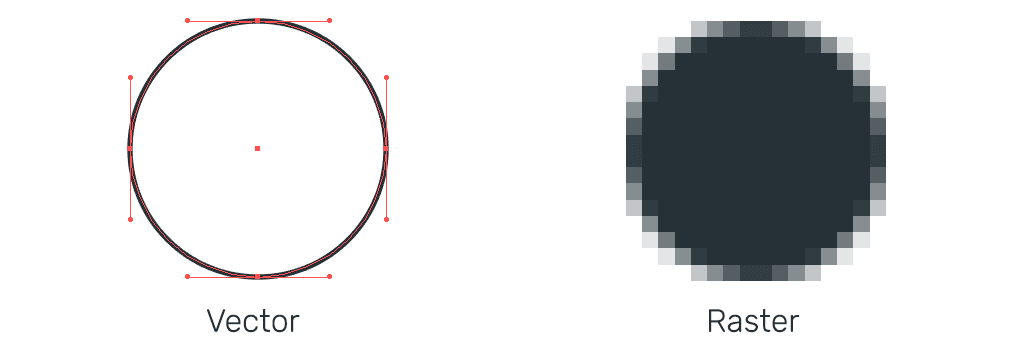
Before we delve into the various formats let’s take a look at some fundamentals. Primarily there are two main types of GIS data: vector and raster.
Vector Data
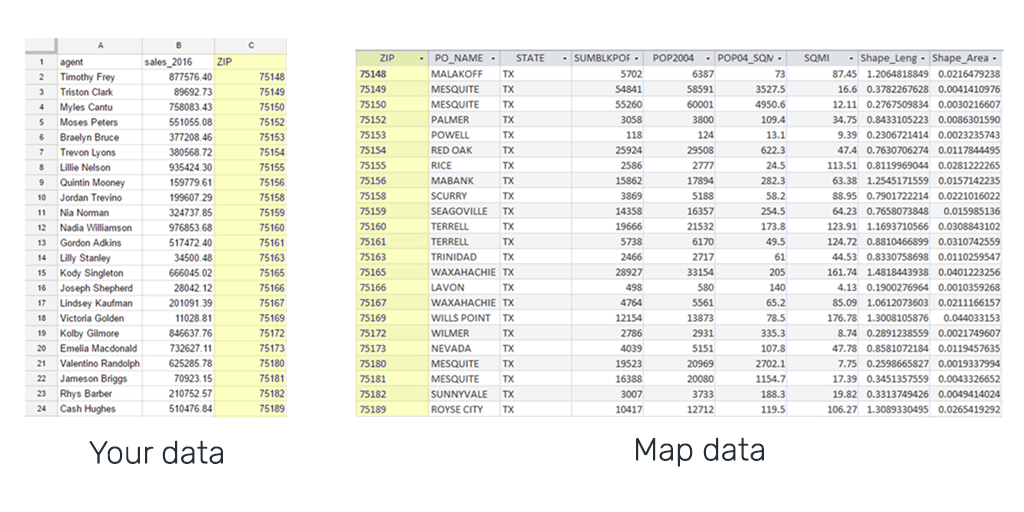
You can think of vector data as instructions for how to render data. The best way to visualize it is to think of it as a spreadsheet with columns that contain your regular data, but in addition it always has an extra column called “geometry”.
That column contains one or more coordinates that describe how to draw the point, line or polygon that represents that feature on the face of the earth.
Raster Data
If vector data is abstract, raster data is literal. Raster data is a bitmap image such as a TIFF or JPEG. This format is usually used for satellite imagery, aerial photography, elevation models and topographic maps.
Introducing the Shapefile
The Shapefile is the most common format in GIS. It’s a vector format that can be read by almost all GIS systems.
The name Shapefile is a little deceptive because the file is made up of at least four parts. The .SHP, the .DBF, the .PRJ and the .SHX.
It’s not important that you remember what’s in each part of of a Shapefile, but I think a brief explanation will help you better understand how GIS data is structured in general.
SHP
This file contains the geometry of each feature.
DBF
This is a dBase file which contains the attribute data for all of the features in the dataset. The dBase file is very similar to a sheet in a spreadsheet and can even be opened in Excel.
SHX
The .shx is the spatial index, it allows GIS systems to find features within the .SHP file more quickly.
PRJ
The .prj is the projection file. It contains information about the “projection” and “coordinate system” the data uses.
Geometry Type
Every Shapefile can only contain one geometry type. This means that every feature in the dataset will be either a point, a line or a polygon. You can’t have a dataset that contains a mixture of geometry types.
Most beginner and intermediate level GIS users never need to look any further than the Shapefile for storing and sharing map data.
So that wraps up our introduction to the Shapefile.
Other Common GIS Data Formats
There a lots of other formats used in GIS. Each with their own distinctive benefits and drawbacks. Here’s a quick list of other common formats that you might come across:
CSV - Comma Separated Value File
Although the CSV isn’t exclusively a mapping format, it is often used in mapping. The beauty of the CSV is its simplicity. This simplicity means they can be read by almost any program including the Excel or Google Docs.
It’s literally a text file where columns are separated by commas and rows are separated by line breaks. When used in mapping, two extra columns are added to hold the x and y, or lat and lon.
For mapping purposes this format is only really used for sharing point layers. The downside of the CSV is that they are very easy to break. Just one comma in the wrong place and the file becomes unreadable.
File GeoDatabase
A file geodatabase is a collection of files in a folder on disk that can store, query, and manage both spatial and nonspatial data.
This is a popular format amongst advanced GIS users. But despite originally being touted as the favourite to replace the old but entrenched Shapefile as the defacto standard for sharing GIS data, the FileGDB never gained the popular support that many believed it would.
The main reason being its lack of support amongst open source GIS platforms.
Tab File
This format is very similar to the Shapefile and is the default format used by the MapInfo desktop GIS system.
KML
This is the format most likely to be known by non-GIS users, as it is the default file format of Google Earth.
Unlike the other datasets covered here, KML does more than just store geometry and attribute data, it also contains lots of configuration options for Google Earth maps.
This extra information however makes KML less portable, as the additional information is only relevant to Google Earth and isn’t of any value to other GIS systems.
GeoJSON
JSON or to give it its full name JavaScript Object Notation is a lightweight data interchange format.
It’s primarily used by software developers due to the ease with which it can processed by web applications.
GeoJSON is a form of JSON that also contains geometry data. It’s not often used as a format for sharing spatial data for human consumption but is very popular as an output for API’s (application programming interface).
GeoTIFF
The GeoTIFF is the most widely supported raster data format. TIFF is a bitmap image format similar to GIF, PNG or JPEG.
A GeoTIFF is just a regular TIFF that also contains special metadata that allows us to know where it should be placed on a map.
A GeoTIFF is an uncompressed format. There are many other raster formats that offer compression to reduce the filesize, but these tend to be proprietary formats that require additional paid software to use.