Spreadsheets are a fantastic way to store and share data. It's ubiquitous, and can be analyzed and transformed into revealing charts and tables. However, there’s only so much we can extract out of a spreadsheet for analysis while remaining concise.
Deep analysis via spreadsheets is too often obscured by the sheer amount of data. While digging into hundreds or thousands of columns of tabular data, it’s too easy miss the forest for the trees.
Providing a thousand-foot view for users to drill down and extract insights often requires pretty serious excel skills and endless sheets of pivot table wizardry, collated content and graphed goodies, presenting the original data as various key takeaways.
Once you’ve created your cache of analyses, sharing it with colleagues is simple enough - until it’s not.
Ever tried viewing a 20 sheet Excel file on a mobile? It’s not fun, and it’s not conducive to understanding any of the findings presented in the data, no matter how good those charts looked on desktop.
Worse still, if you’re also handling geographic data in your spreadsheets, it’s likely you’ll be missing some of the most important findings. The insights that can be illuminated when spreadsheet data is mapped provides the bridge for that thousand-foot view: the forest that’s been in front of us the whole time, obscured by the minutiae.

Web maps are superior to spreadsheets
Web map visualizations (also known as Online GIS) and mapping spreadsheet data to uncover the meaning of your location data delivers powerful outcomes for anyone working with spreadsheets. Data and trend discovery, visualizing geographic hotspots and opportunities becomes plainly apparent once you have created a map from spreadsheet data.
Online maps are superior to spreadsheets in another fundamental way: accessibility. Web maps are made for mobile, and look and feel just as visually impactful on mobile or tablet as they do on desktop.
The key advantage of visualizing your data on maps, is that you can analyze your empire alongside other spatial data, like income or employment data from a national census, or understand your regional logistics needs by overlaying county and state spatial data that covers just about anything you can think of - flood and natural disasters, transport and rail networks.
No matter what type of data you have, web maps provide superior experience, provide spatial context and insights for business data analysis, sales mapping, real estate and territory mapping, and store performance - really, anything you've spent time and money on collecting in a spreadsheet; the possibilities are endless.
Creating maps from spreadsheets
There are a number of options for mapping spreadsheet data - some free, some premium. Most deliver adequate results, but all too often your data won't quite fit into the preset systems, so it's common to find records missing from your mapped data.
An obvious choice might be Google maps. You can make simple maps on free services like Google maps, but then Google’s got all your data, and all your underlying data is exposed to the public when you need to share your maps. It also turns out that unless you want to pay them the big bucks—and we’re talking proper big bucks and complex credit usage tables that obfuscate the actual price—you can’t do much else with your data on Google maps besides just adding a few colored markers and maybe embedding it in your website.
That’s fine for a map of your outlets, and maybe that’s all you need. If so, head on over to Google’s map maker and go wild.
Bye!
Are they gone?
Ok, for those that want more—you and I, here’s where it gets good.
So how can I extract insights from my spreadsheet data?
Firstly, in order to display your address data on a map, we’ll need to generate the geographic coordinates (latitude and longitude) of the location of each address in your spreadsheet.
We can do this through a process known as geocoding.
Geocoding is the process of assigning geographic coordinates to a physical location.
In an ideal world, technology would just take care of all this for us, right? We’ve got self-driving cars, so why not self-mapping spreadsheets? One day, perhaps.
Unfortunately, spreadsheets aren’t quite at Philip K. Dick-level self-consciousness just yet, so while we wait for that (terrifying) day, we need to prepare and process our own address lists into map-ready data ourselves.
Thankfully, it’s really quite simple (roll up sleeves now).
It requires a few tools - free, open source tools that are readily available. If you’re able to create and manage your spreadsheets and databases of suppliers, stockists, customers, whatever you bread and butter is, then it won’t stretch your abilities at all to learn how to turn all those valuable addresses into even more valuable coordinates.
Once you’ve got your coordinates, it’s a piece of cake to then visualize them on a map, and extract those juicy insights that can help to energize and transform your business through spatial intelligence.
We’ve put together a foolproof tutorial that will walk you through all the steps required to convert your spreadsheet into a map by geocoding the addresses in your spreadsheet.
In this tutorial we’ll cover the following:
1. Installing Quantum GIS (QGIS)
QGIS is a fantastic open source (and free) desktop GIS program
2. Installing MMQGIS
A free suite of plugins that extend QGIS functionality with geocoding capabilities
3. Converting your spreadsheet of addresses to CSV
4. Geocoding your addresses
5. Mapping your spreadsheet
Gather your tools
For this tutorial, you'll need two things before we begin:
- Your spreadsheet (or our example data) and a spreadsheet application (Excel, OpenOffice Calc, Google sheets, etc)
- Download QGIS - the best free open source desktop GIS.
If you don’t already have QGIS installed, download it now. It’s completely free, and is a great platform to continue learning about mapping and GIS.
Don’t worry, you don’t need to be familiar with QGIS to complete this tutorial. However, if you would like to learn more about it, then here is a great place to get started.
If you don’t have any address data of your own, but would like to follow along, you can use the spreadsheet I'm using in this tutorial. Download example spreadsheet:
Download our example spreadsheet
For this tutorial, we’re using QGIS 2.18, but it should also work much the same on earlier and newer versions.
1. Installing QGIS
First things first, download and install QGIS.
Unlike a lot of desktop GIS, QGIS works on all major desktop operating systems, which makes it easily accessible.
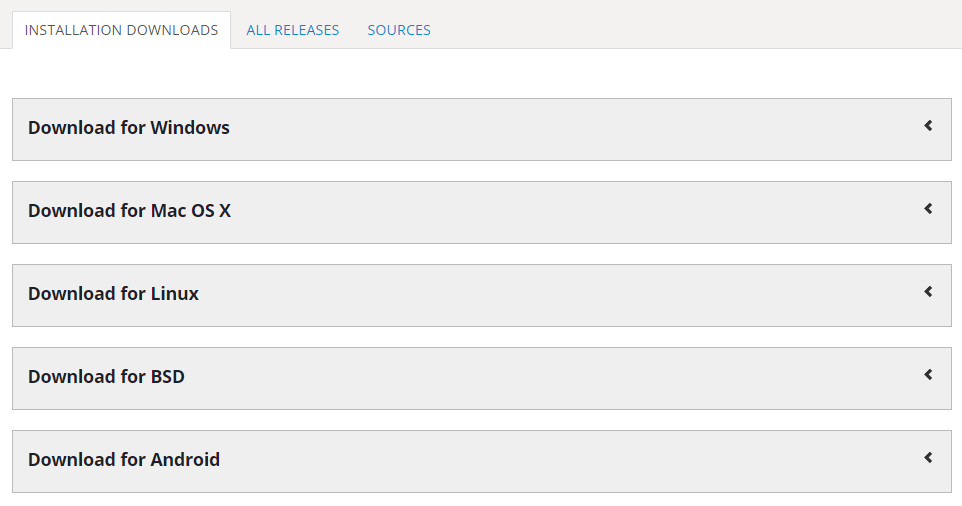
Click on your operating system to see the available versions, and click on the link to start the download. In this tutorial, we’ll be using version 2.18, but you can use any version that is compatible with your system.
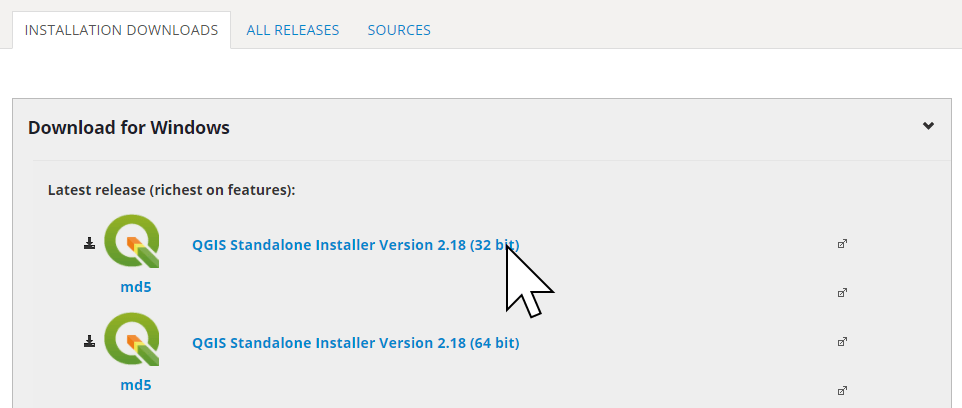
Once the download has finished, install QGIS and move on to step #2.
2. Install the MMQGIS Plugin
The first thing we need to do is install the MMQGIS plugin that adds geocoding capabilities to QGIS. We’ll feed it the list of addresses, and it will output a list of shiny new geographic coordinates.
MMQGIS is included in the QGIS Plugin Repository so we can install it from directly within QGIS.
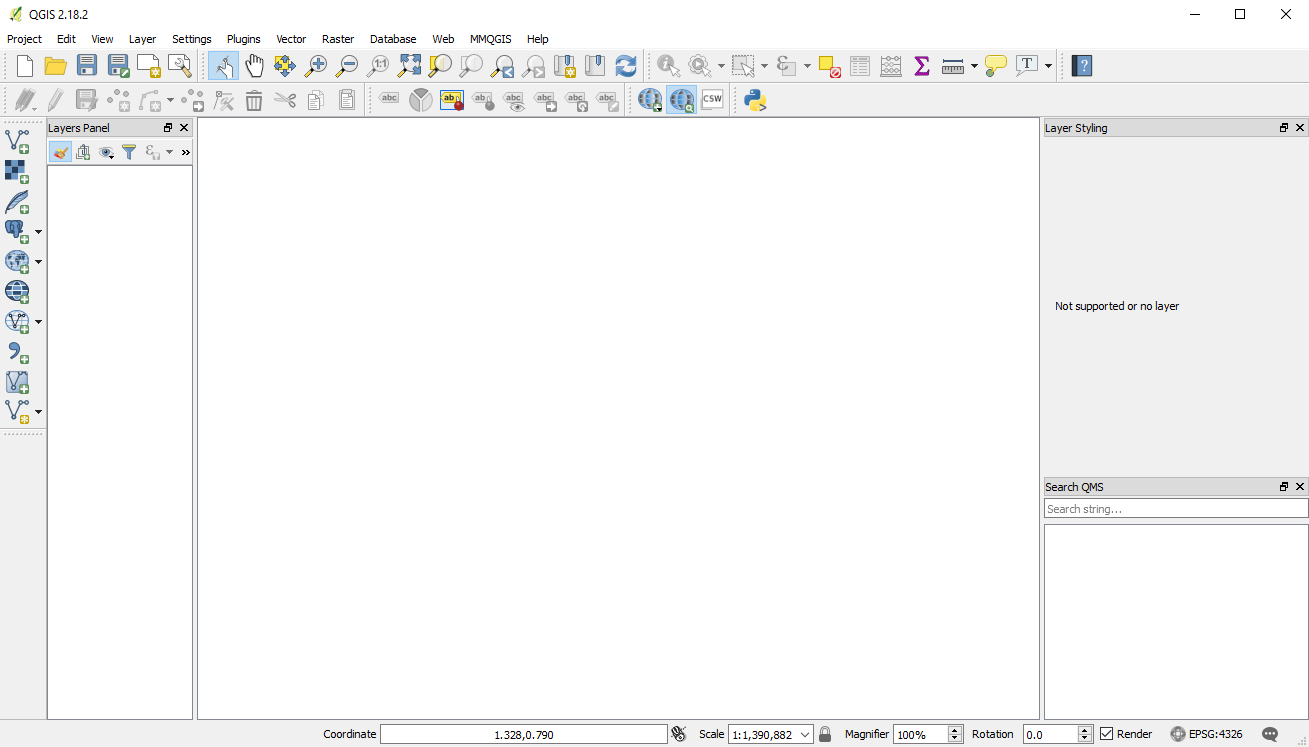
Open up the QGIS application to get started.
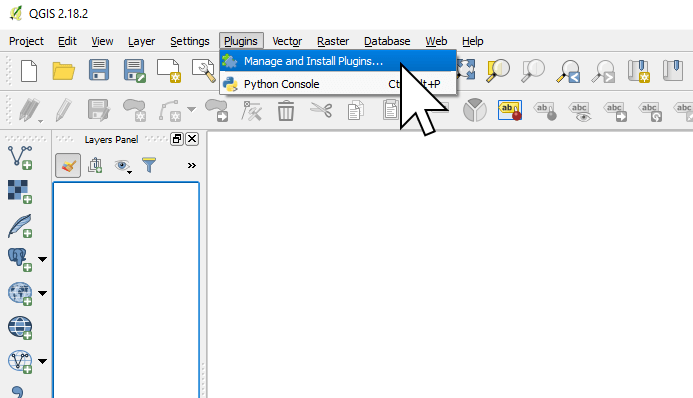
1. Choose “Plugins” from the menu bar and choose “Manage and Install plugins…”
2. Search for MMQGIS in the top search bar, select if from the results, and click "Install plugin".
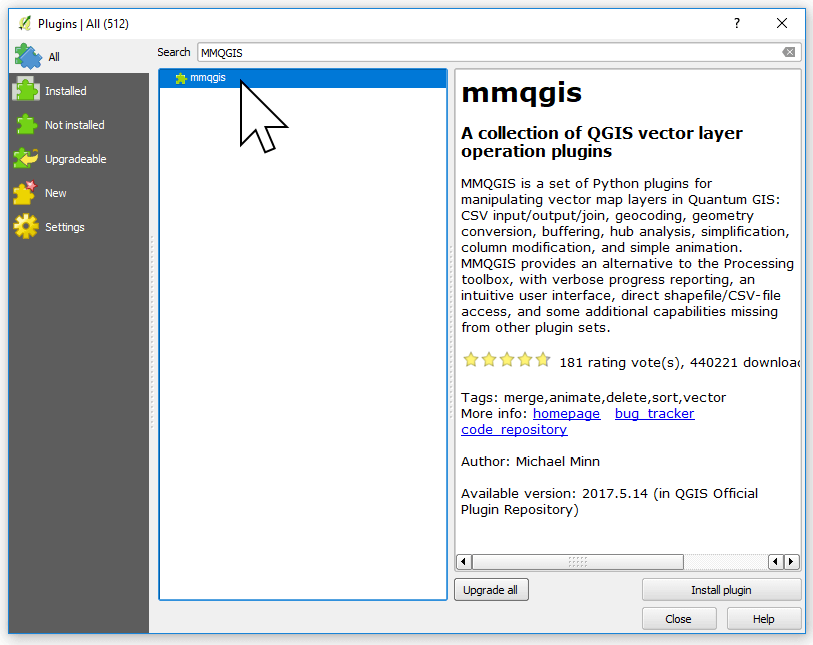
Once the plugin is installed, close the Plugins window.
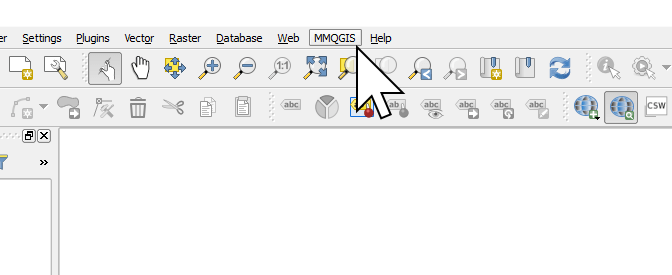
You should now see a new menu item called “MMQGIS” next to the Help menu.
3. Converting Your Spreadsheet of Addresses to CSV
Let’s return to our spreadsheet for a moment. Before we can geocode the list of addresses, we’ll need to check our spreadsheet to ensure we will get the best results from the geocoding.
Geocoding requires that the data is in CSV (comma separated values). A CSV file is essentially a spreadsheet, just without all the formatting and colors you’ll find in Excel.
The example spreadsheet provided is already prepared as a CSV, so if you’re using that you can jump straight to the next section.
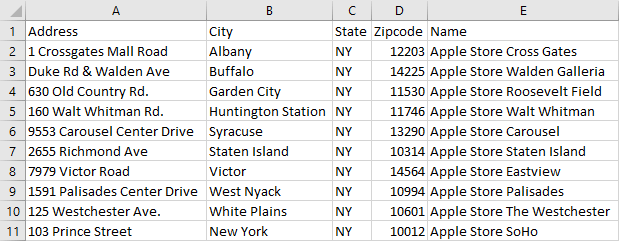
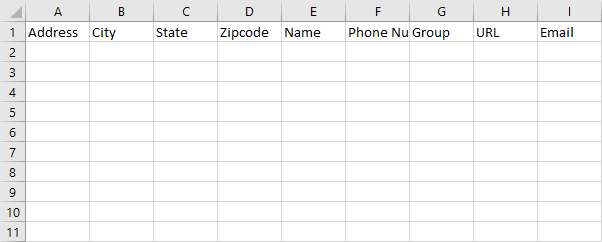
Your spreadsheet with addresses must be broken into columns called “address”, “city”, “state” and “country”. e.g.:
- Address: 630 Old Country Road
- City: Garden City
- State (or equivalent outside US): NY
- Country: USA
Most geocoders are quite smart, and will be able to work out that NY in the state column is New York, so don’t worry if your data is in a slightly different format to that shown above.
If all of the address is contained in a single column then you will need to split the address into the separate fields - address, city, state.
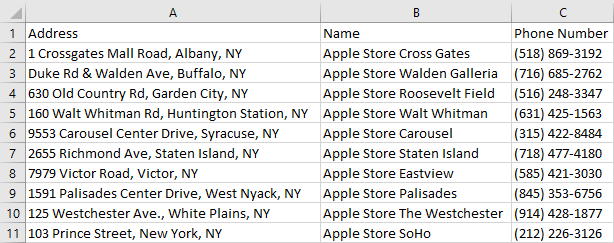
Addresses in a single column need to be separated into individual fields before geocoding.
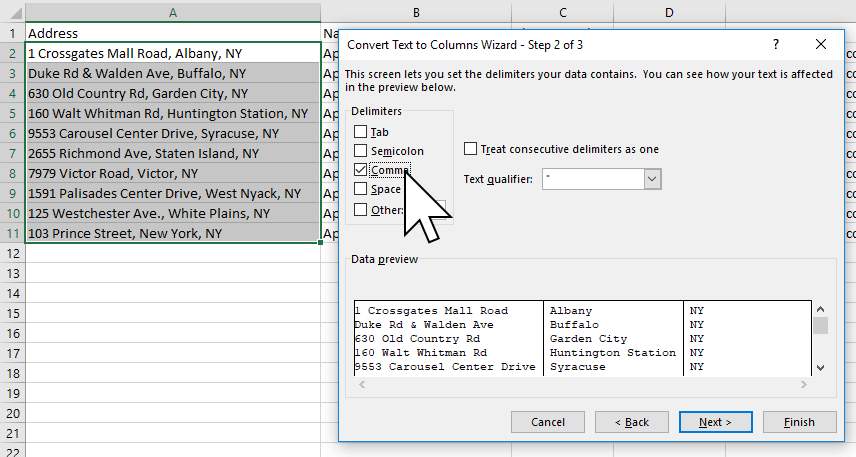
Excel’s Convert Text to Columns Wizard lets you quickly split your address into individual columns.
If you’re using your own data, you can convert your spreadsheet to a CSV file in Excel or any other spreadsheet program by opening the spreadsheet and pressing “Save As” then choosing “CSV (Comma delimited)” from the “Save as type” option.
4. Geocoding The Addresses
Now that we have our data in the correct format it’s time to geocode it in QGIS.
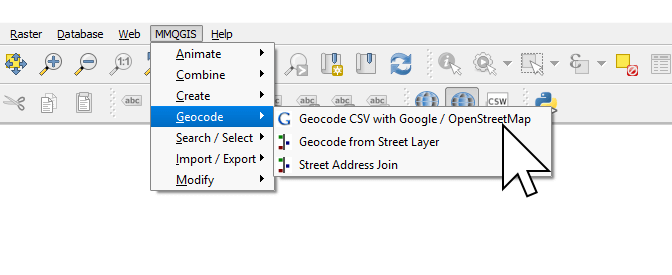
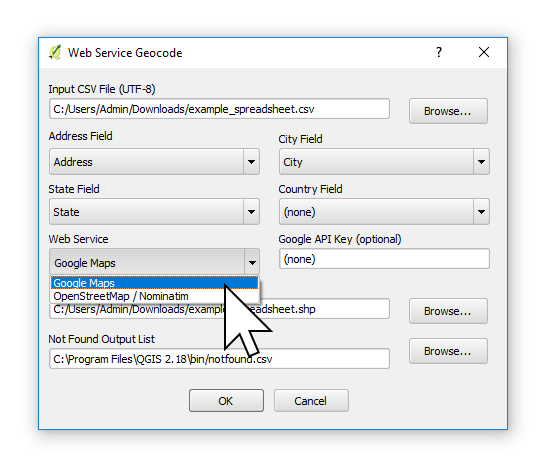
1. In the menu bar go to: MMQGIS → Geocode → Geocode CSV with Google / OpenStreetMap.
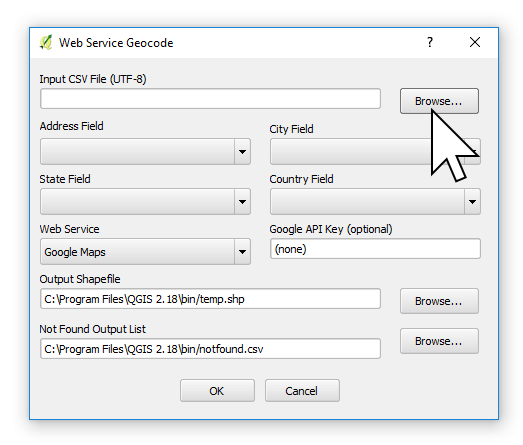
2. Click Browse... and select your CSV
3. Once you've selected your CSV file, we'll need to tell the Geocoder which columns represent the individual address components - the address, city, state and country. MMQGIS will do it's best to detect the appropriate column names (and it's best is often very good), but if you use obscure column names or a different language and it doesn’t get it all correct, just click on the dropdown menu and choose the correct column in your CSV.
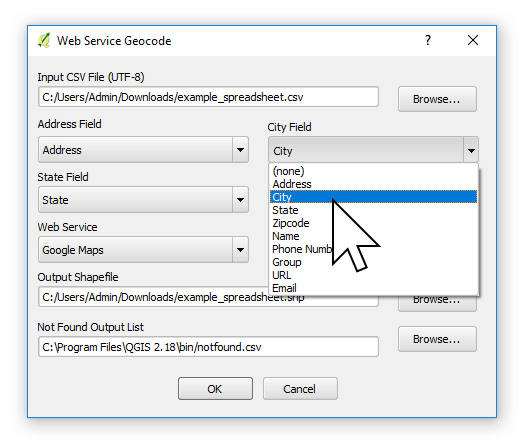
We also have a choice of web services to perform the geocoding. We can choose from Google or OpenStreetMap/Nominatim.
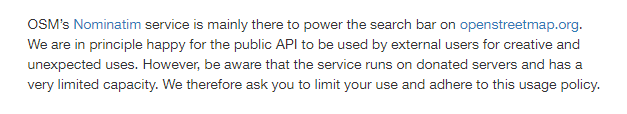
OpenStreetMap has no overall limit. However, the Nomanitim geocoder is designed to support OSM mapping initiatives, and due to the community (and donation) driven nature of OSM, it's not a suitable choice for ongoing business use, without chipping in to the OSM intiative.
Google tends to provide the best results but only allows you to geocode 2500 records per day without a premium API key.
Update: The Google Map Platform now offers only 40,000 geocodes per month "free", using a $200 USD Google Maps Platform credit, and requires enabling billing. Learn more
Pro Tip: If your CSV has more than 2500 records and you wish to use Google you can break the spreadsheet into separate files each with 2500 records and process one each day. Once complete join the output files back together using MMQGIS’s merge layer function.
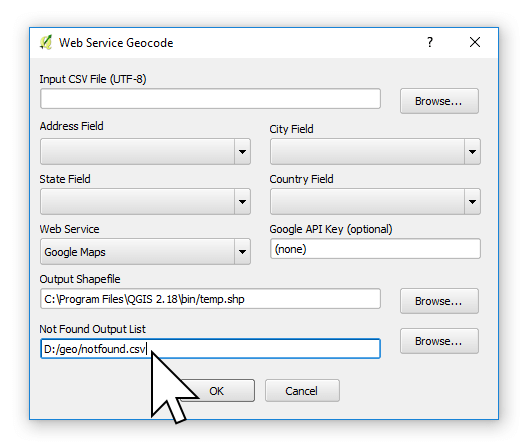
5. Now make sure the Output Shapefile path and the Not Found Output List path are valid, and you have permission to write to that location. To change the path, just click on the Browse button and choose a preferred location.
Geocoded results will be stored as a Shapefile which, despite it’s singular name, is actually a collection of at least four files (.shp, .shx, .dbf, .prj). The Shapefile is the de facto standard for storing GIS data and nearly all mapping applications support it, including Mango.
A second file will be stored that contains a CSV of any records that could not be successfully geocoded. These records usually have an incomplete address, spelling mistakes, or are in remote areas not covered by the geocoder.
Important
On Windows the default output path for the Not Found Output List is often in a system folder that MMQGIS can’t write to, and you will receive an error if you use that value. Update the Not Found Output List path to a path you have permissions to access (like My Documents or Downloads) before continuing.
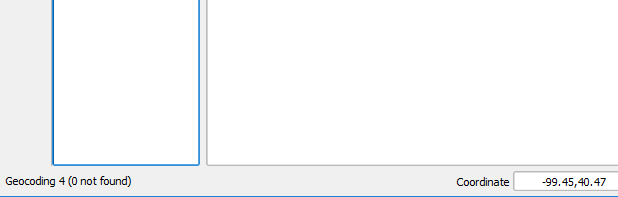
6. We’re all good to go. Hit OK to proceed with the Geocoding.
7. While processing, you’ll see the progress in the bottom left corner of QGIS
8. When the geocoding is complete, your address points will appear in QGIS as circle markers. If you don’t have a basemap turned on in QGIS, you’ll just see floating points against white - this is normal and means your geocoding is done and your geocoded coordinates are now in a shapefile in the Output Location you set at step 5 above.
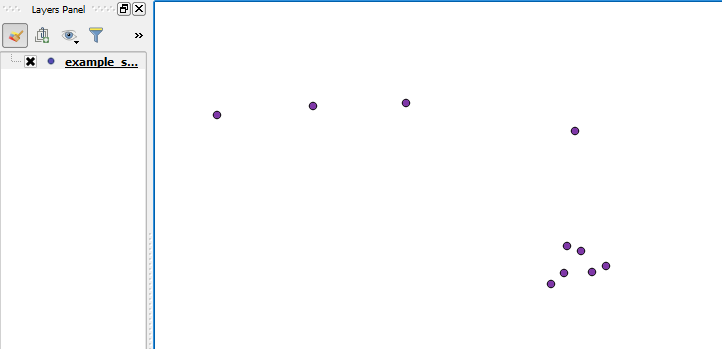
9. Go to the folder that contained your notfound.csv to see if any addresses weren’t located. In this case, an empty CSV is a good result!
5. Mapping Your Addresses
Now that you have your Shapefile, let’s upload it to Mango and take a look. If you don’t yet have an account you can sign up for a 30-day free trial here.
Once you have signed in to your account, we’re ready to make a map!
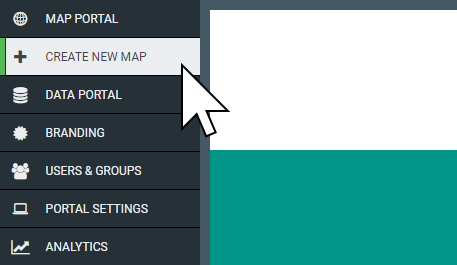
1. Press the “CREATE NEW MAP” button in your administration sidebar.
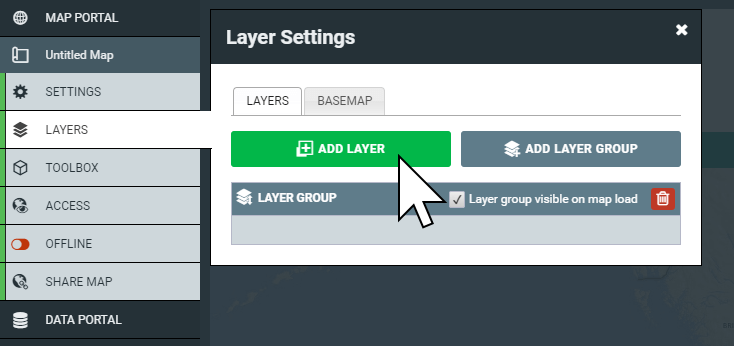
2. When your map is ready, click “LAYERS”, then click on the “Add Layer” button.
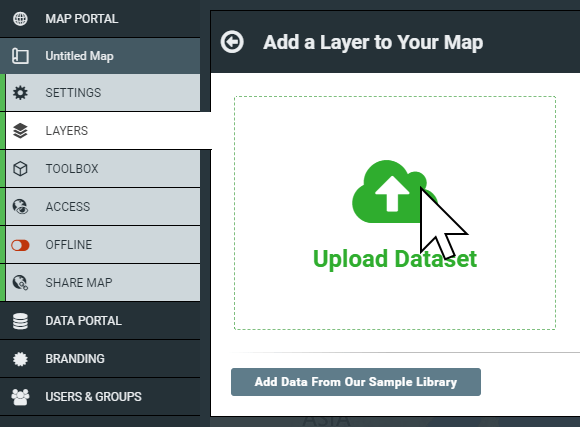
3. Now click on “Upload Dataset”
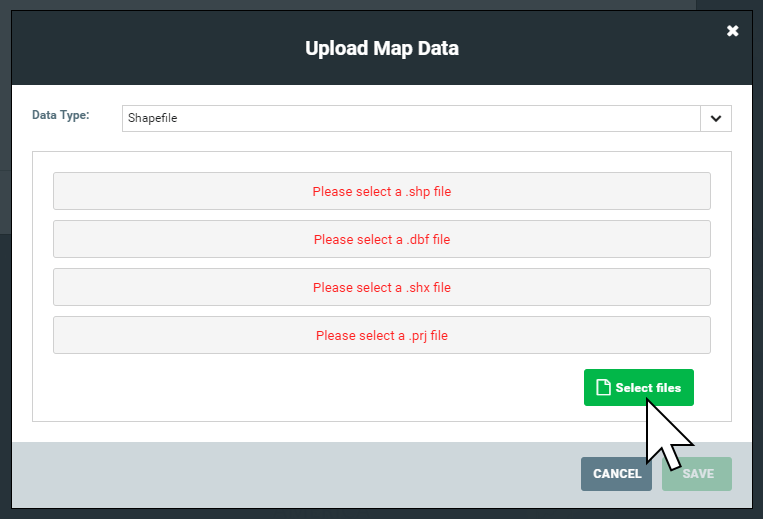
4. Here you can select the type of data you want to upload. We’ve got a Shapefile, so we don’t need to change anything. Click on Select files
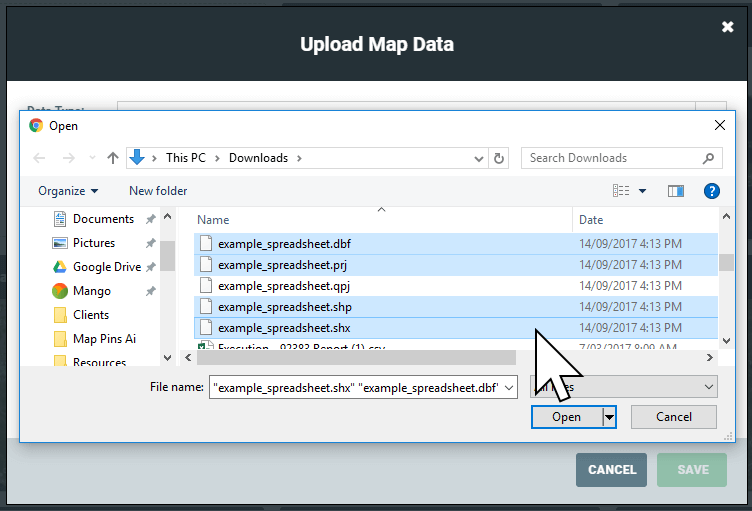
5. Navigate to the output location and select the four files of the Shapefile generated by the geocoder and upload them to Mango. To select multiple files at once, press and hold Ctrl and clicking each file (⌘ + click for Mac).
6. Once the upload is complete, press SAVE and Mango will process your data.
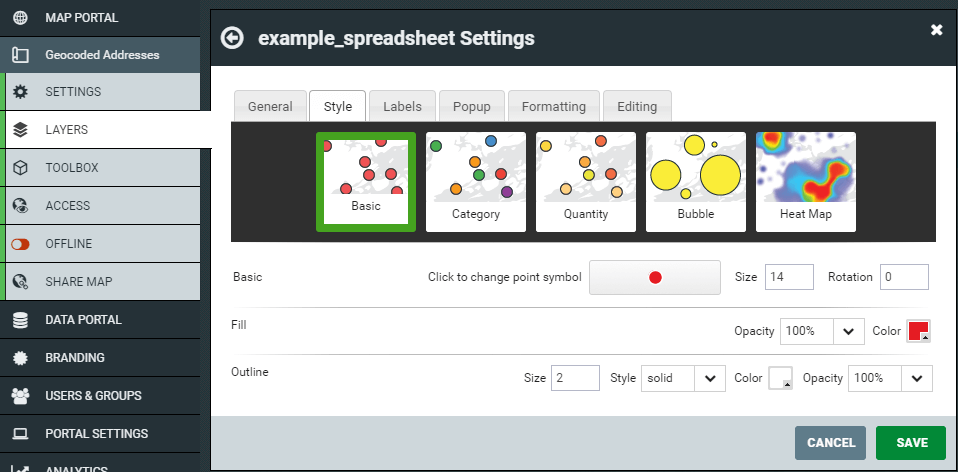
7. When the processing is complete, you’ll be shown the Layer Settings panel. Here, simply select a color for your points, and hit Save.
8. Admire your geocoded locations on your map
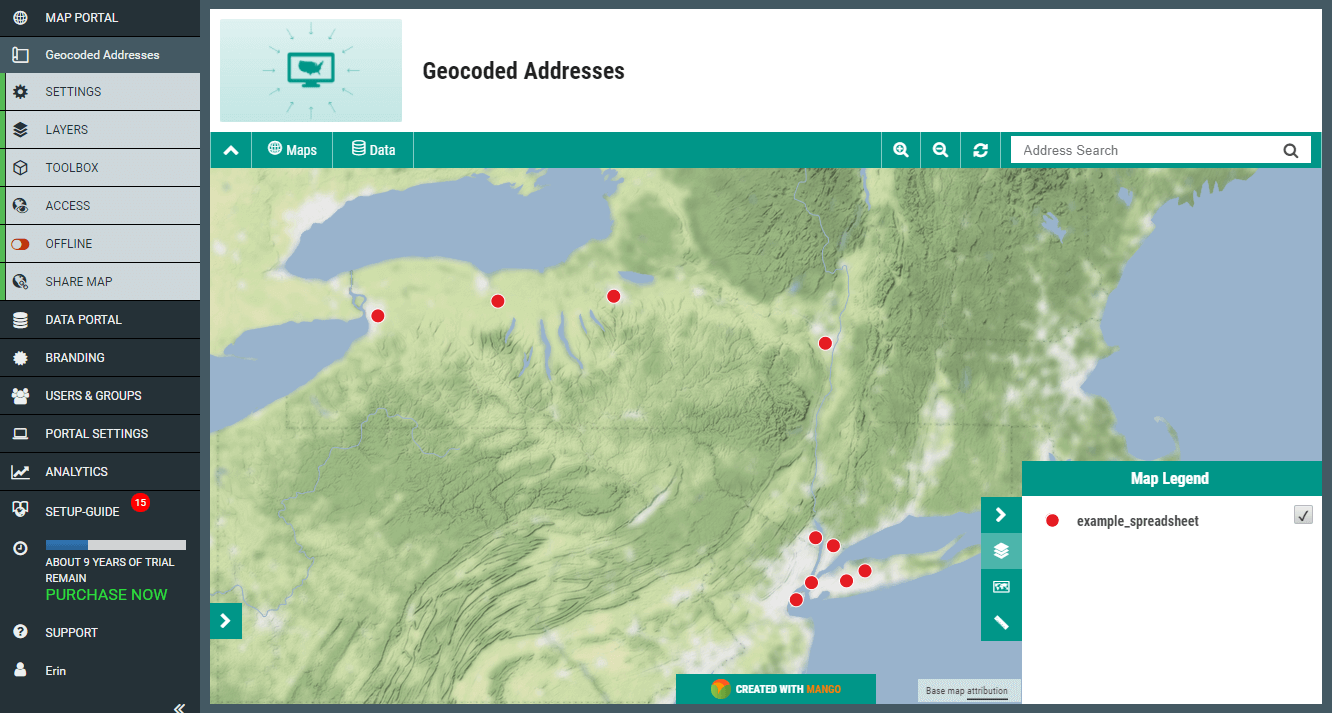
It’s that simple!
Now you've got your addresses on a web map, you can add supplementary map layers on top or below to provide context and extra information, or add tools like Mango's Proximity Analysis tool to perform spatial queries to find even deeper insights such as Cities within 100mi of a dealership with population above 50,000.