Great web maps serve a singular purpose: delivering answers and insights for users. Often, all that users need to draw conclusions is a stunning web map visualization. But sometimes, users need more power. Are you delivering that power efficiently?
An arsenal of functional, usable web map tools is essential to empower users to dive deep into the map data and extract answers with precision and accuracy.
It’s not difficult find examples of web maps that contain every possible morsel of juicy data in dozens of layers and a selection of expert tools, but are they more effective in delivering positive outcomes for most of your users?
More often than not, the answer is no.
All the layers in the world might make it simple for you to deploy your spatial catalogue, but is likely to hinder your users from extracting their answers.
Worse still, those expert tools need an expert to operate them. The reality is, most users of your maps are not GIS experts.
The greatest maps are those that can answer a question with the greatest accuracy in the least amount of time. Usually this means providing users with thoughtful and functional web map tools that aid their analysis.
Yet map tools not only have to be functional, they need to provide the simplest path for users to get from your point A: your map; to point B: their answer.
And no, we're not talking routing here, but usability.
The greatest gift you can give your online GIS users isn’t the entire smorgasbord, but a considered and functional selection of web map visualizations that focus on one topic, and the tools required to extract insights.
A grave mistake made by many GIS professionals who are making online web maps, is that they assume the end-user is as proficient with navigating and analyzing GIS maps as they are.
As geospatial technology filters down to consumer level applications, it exposes web mapping and online GIS to an audience that aren’t GIS professionals, and most certainly not au fait with GIS tools and terminology.
They don’t know, and they don’t care about how to write an expression that will filter out redundant data, and nor should they.
There’s a little bit of pride inside of us that says, “Well, I had to learn it; let them learn it too.”
As communicators of data through web mapping, it should never be our goal to erect barriers to prevent our users from finding answers.
Our ultimate purpose should be to deliver value to users; value and insights that they may otherwise not have gained, if it weren’t for us. That's a result worth being proud of.
So, uour job as a map maker is to make it easier to extract answers, not harder.
It stands to reason then, that when deploying a web map application designed to answer questions, our web map tools should provide the path of least resistance to those answers.
We need to empower users to find those answers through familiar paradigms, and simple workflows.
In other words: delivering the tools users need.
We built Mango with this goal in mind. Making it easier than ever before to deploy focused maps that deliver simple workflows for users to swoop in, extract answers, and exit with new-found insight.
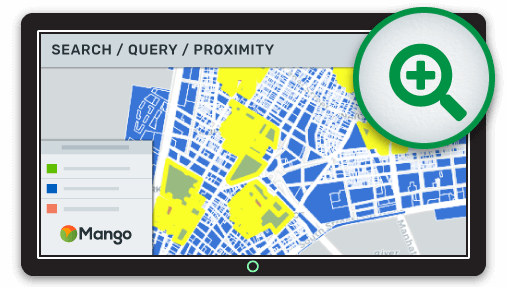
A perfect example of this is a web map proximity search.
If we take the desktop GIS approach, presenting the user with a wall of options and equations to construct, it's likely they'll walk away without any answers.
That's a complete failure of communication.
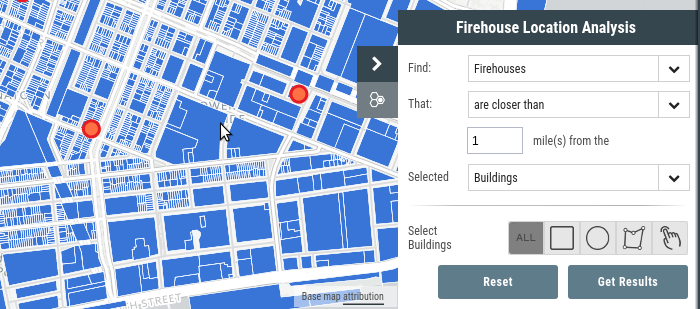
In Mango, users can instead conduct proximity analysis via a natural query builder:
Find Dealerships that are closer than 5 miles from My Competitor’s Dealerships
The results are presented in a simple to understand selection set: resulting dealerships within 5 mi of competitors are highlighted, allowing for visual analysis, and the resulting selection set is available as table of attributes, a report summarizing the values in the selection, or even as a downloadable file to extract and build new maps.
Reducing complexity means positive outcomes for users
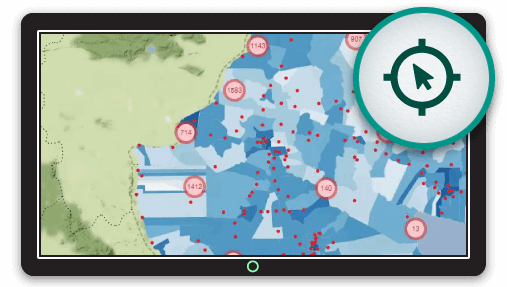
The visual complexity of maps with lots of point data is often a distraction, so the clustered pushpin tool reduced the visual noise by grouping together points in close proximity, with each cluster containing a color and the number of pins within that cluster to easily visualize high density areas.
Differentiation of features can achieved with category based colors, and you have full control of the category class breaks and the zoom level where clustering ends and break out into point markers.
Enabling the print tool in Mango allows users to generate customized PDF maps of their areas of interest, complete with feature highlights and data popups containing charts, tables, or photos.
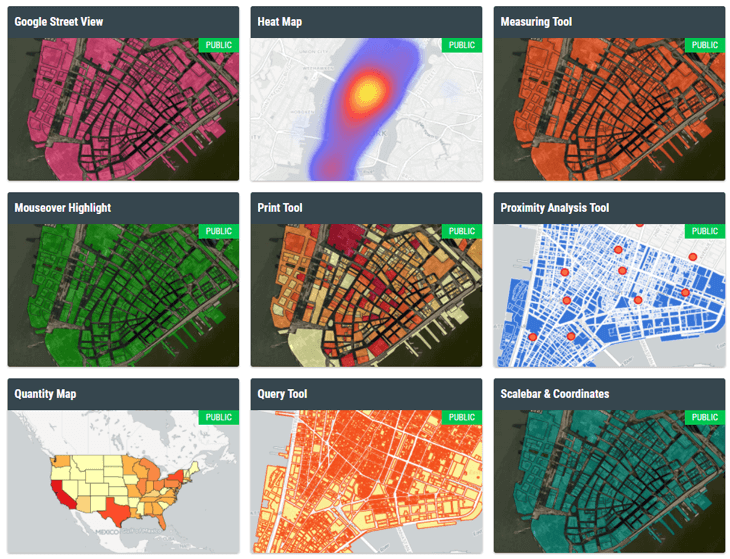
Mango offers these and a host of other functional map tools designed with a usability-first approach for both end-users of your maps, and you, the administrator, allowing you to create fantastic visualizations with web map tools that deliver value for your users.
The Mango toolkit features four different classes of map tools:
- Search and Analysis
- Visualization
- Information & Display
- Core Map Tools
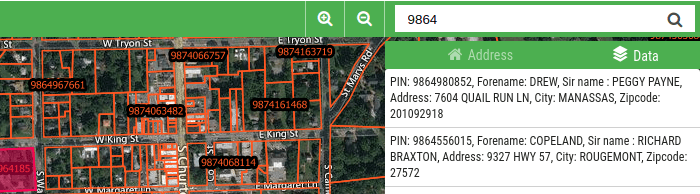
Search and Analysis includes Address, Attribute, and Coordinate search in a familiar and simple search window with full-text address search, and autocomplete for both address and attribute search. Lat/Lon input is also provided for rapid place finding when coordinates are known.
Diving deeper, a fully customizable Advanced search tool lets you build a targeted multi-field boolean search tool for specialized applications.
Mango’s Query and Proximity Analysis tools provide desktop-level database queries, without desktop-level complexity.
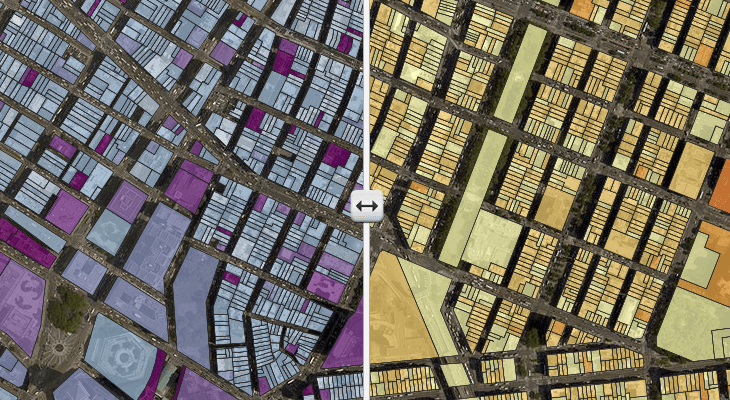
Visualizations don’t end with map layer styles. Mango's Visualization tools include Slide-to-Compare - allowing two map layers to be compared side by side. Direct comparisons are now simple - users can drag a slider side to side to reveal changes in data or compare visualization, or even compare aerial imagery to understand construction progress or forestry analysis.
All the core tools you would expect on a web map are available - measure, print, scale bar, and coordinates at the mouse position.
The full Mango web map toolbox includes:
- Search and Analysis
- Address Search
- Attribute Search
- Coordinate Search
- Custom Search
- Query Tool
- Proximity Analysis Tool
- Visualization
- Slide to Compare
- Measure Area
- Measure Line
- Mouse Highlight
- Clustered Pushpins
- Information & Display
- Custom Copyright/Attribution
- Geolocation
- Coordinate Display
- Scale Bar (metric and imperial)
- Share & Bookmark
- Map Tools
- Basemap Switcher
- Google Streetview
- Refresh Map
- Print Composer
- Sketch
Test drive our tools with our example portal
Click above to open the Mango Example Portal
See for Yourself How Simple It Can Be to Deploy Web Maps with Mango
Try our Enterprise plan free of charge for 30 days and explore the full web map toolkit. All our tools are available on every plan, so no matter the scope or size of your mapping needs, Mango can deliver the tools your users need.