Gut feeling is good, but
The trend towards spatial intelligence in business has seen an explosion of web mapping and online GIS visualizations over the past few years. This new paradigm, built on the shoulders of two centuries of thought and innovation, allows us to analyze and explore data visualizations in new, insightful ways.
As inherently visual creatures, we're drawn to patterns and complexity. There's something inside us that needs to create order out of the chaos of the world; classify, map, and analyze our surroundings.
In 1855, French photographer Gaspar Felix Tournachon, known by his pseudonym Nadar, patented a method for collecting aerial imagery for map making and surveying. It took him a further 3 years to then perfect the process. Using a tethered balloon of his own design - complete with darkroom, he was the first to photograph above the ground.

Nadar's earliest surviving aerial photo of Paris. (source)
Cameras strapped to kites, rockets - even pigeons - followed as like-minded inventors scrambled to find new ways to get higher, better shots. The advent of the airplane revolutionized the field, and aerial photography and mapping became a stalwart of surveying and data collection.

Pigeon-assisted aerial photography in 1907. (source)
Since then, technologies that allow us to view and understand the world from above - before only available to those with large budgets, and high levels of technical knowledge - have become widespread.
Like many innovators before, Nadar’s idea flipped a switch in the collective consciousness, marrying technology with our inherent need to analyze, explain, and explore the world around us. Imagery has led to abstraction; representing the world through visualizations of datasets that contain both geography and a multitude of data that tells the story of place, time, and population - visualizations that let us pull back the curtain and apply analytical observations that reveal patterns and trends that weren’t apparent in tabular data.
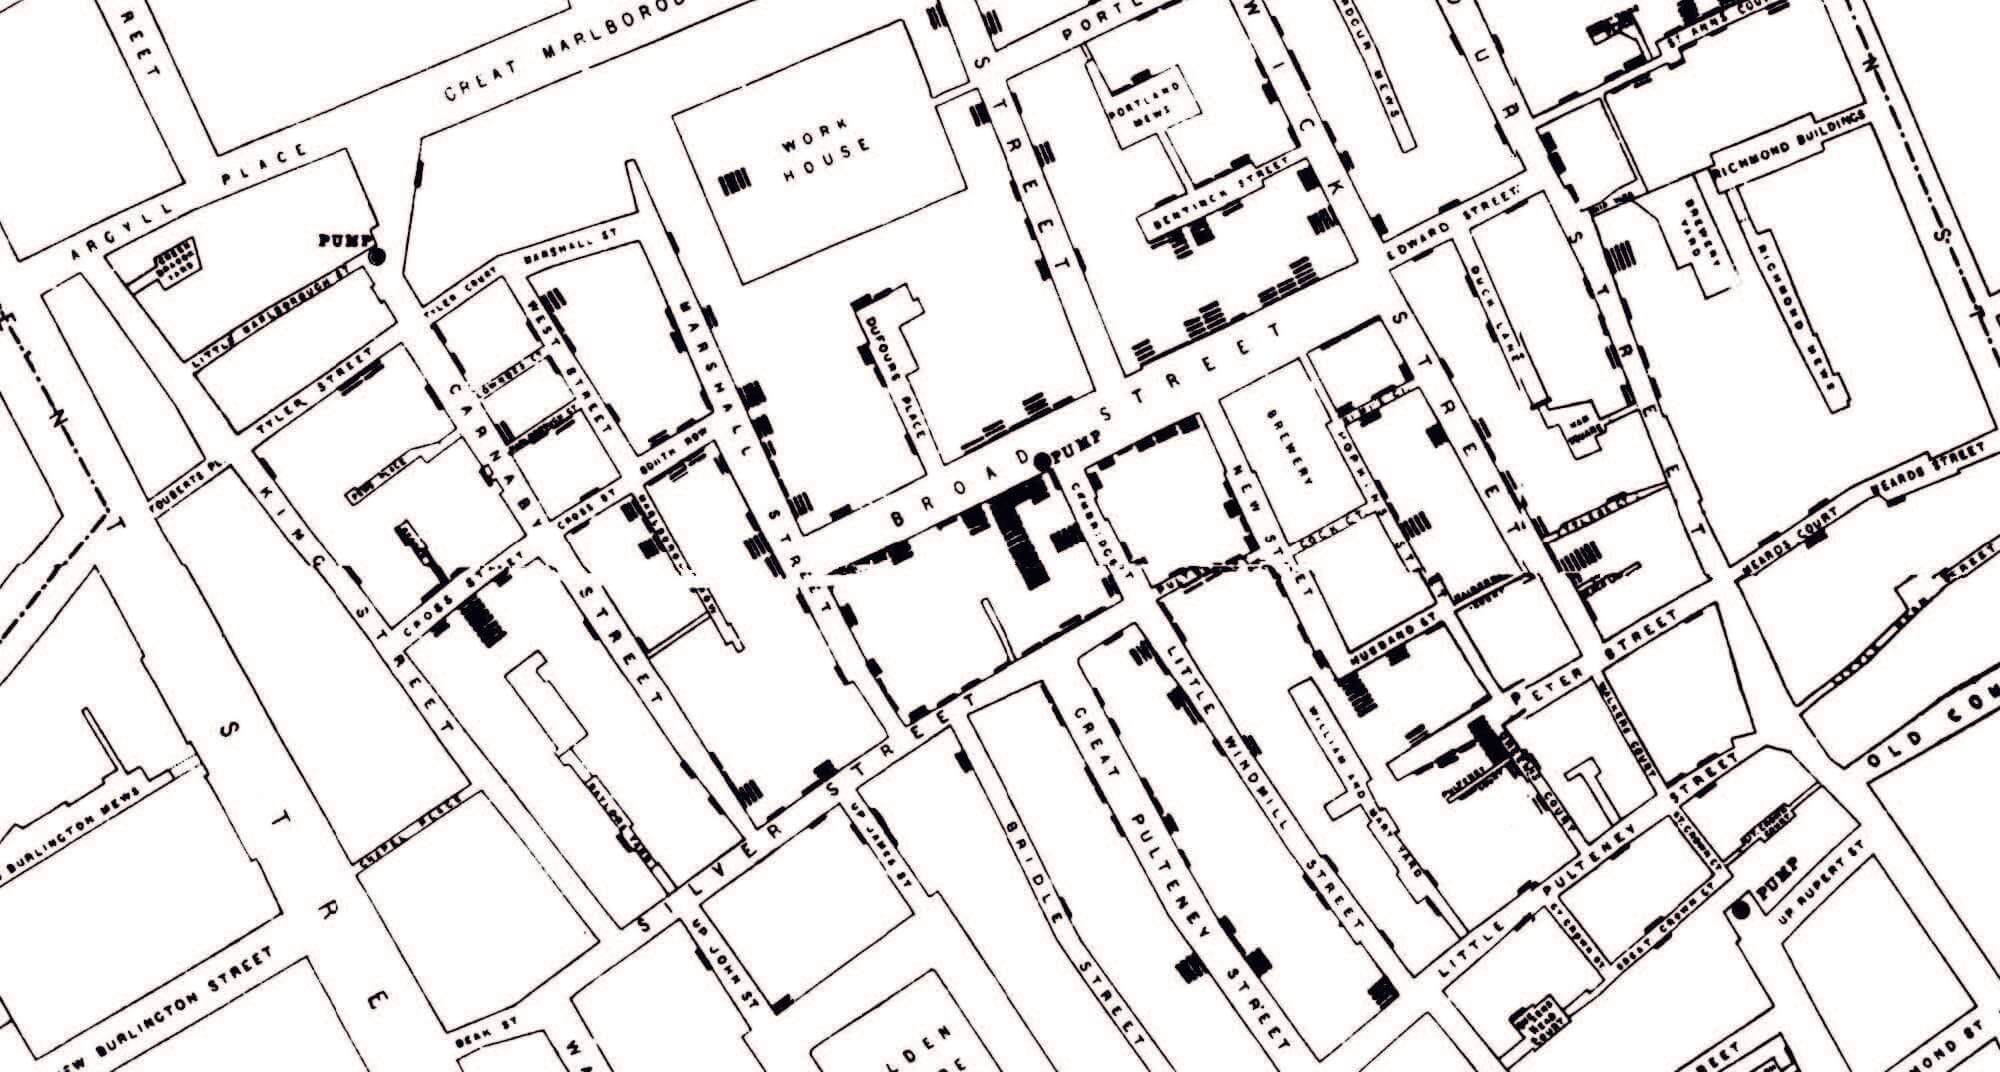
John Snow’s 1854 cholera map of London that displayed deaths in households as bars on a map - one of the earliest known examples of using geographic inquiry to understand a health epidemic.
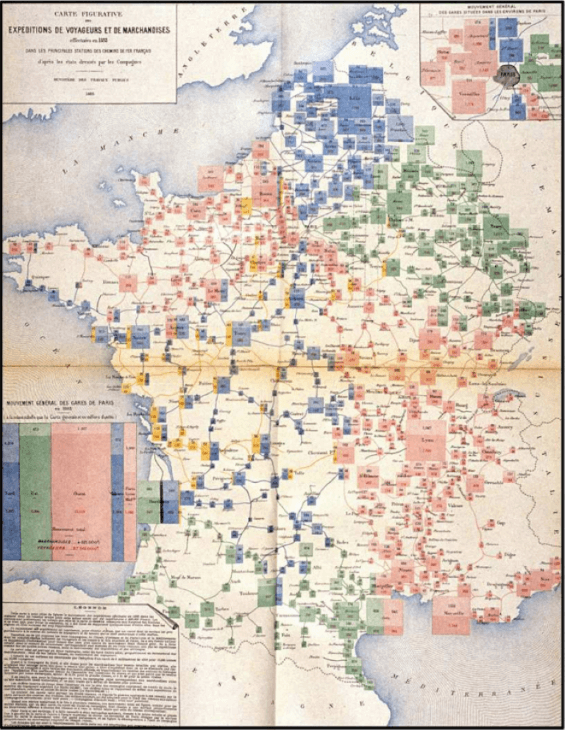
Mouvement des voyageurs et des marchandises dans les principales stations de chemins de fer en 1882 (Movement of travelers and goods in the main railway stations in 1882)
Today, the ubiquity of smartphone technology puts online maps in the hands of billions and continues to transform the way we think about, and interact with the world through maps map visualizations.
Through the media, we're exposed daily to ever more complex visualizations that explain our news, our society's challenges, strengths and weaknesses, laying crucial paths to solutions. These visualizations have become familiar to us, and even the layman is developing a vocabulary to understand these visualizations.
This growth has seen the technology needed to produce web map visualizations increase in capability, while become ever more accessible, with the demand for simple yet powerful tools driving innovation and decision making across all sectors and industries.

Visualizing the world's air traffic - flightradar24.com
The net result is a public that is better equipped with a more refined visual literacy, and a familiarity with interacting with digital maps, and business is seeing the benefits of leveraging this new language.
For anyone making business decisions, online GIS visualizations can reap benefits previously only available to the big guys. Where once budget, expertise, or scarcity of data restricted us, it's now possible to take our data and deploy web map visualizations that illuminate a range of business and social insights with intuitive tools that make simple the most complex visualizations.
If you’ve begun the process of seeking out an online GIS platform to begin tapping into the spatial intelligence hidden within your data, you have probably found there is no shortage of options available ranging from the behemoths of the industry to bespoke and DIY solutions. You’ll also find there may still be a knowledge gap in your organization that holds you back. Servers to maintain, complicated usage consumption and processing credits, not to mention the often complex programming required.
The good news is, is doesn’t have to be as hard as it may first appear.
Creating Great Web Map Visualizations
In a perfect world, great web map visualizations should be:
- Configurable with a click
- Easy to adjust
- Able to be created without high level GIS expertise
- Able to be layered with other visualizations
- Able to be grouped and disabled in a functional legend
- Able to be shared easily
- Able to be viewed on any device, anytime, anywhere
- Able to be created in less time than it takes for the intern to come back with the coffee
The solution exists: Mango.
We made Mango specifically to check all those boxes, and put the power of web map visualizations in your hands to communicate your data with colleagues, clients, and communities.
No matter whether you have point, line, or polygon data, Mango’s visualizations can transform your datasets into attractive interactive web maps that can be distributed to the world, or secured within your organization’s map and data portal.
Mango offers a range of common web map visualizations, all which can be created from your data rapidly and without writing a single line of code:
- Category maps
- Quantity, or Choropleth maps
- Bubble maps
- Heat maps
Point data, such as addresses, can be visualized with basic dots of uniform size and color to represent physical locations, or can be visualized with category styling to indicate both location and a class. Quantity point visualization offers color-ramped points that are shaded in relation to a numerical attribute in the data, like sales or population.
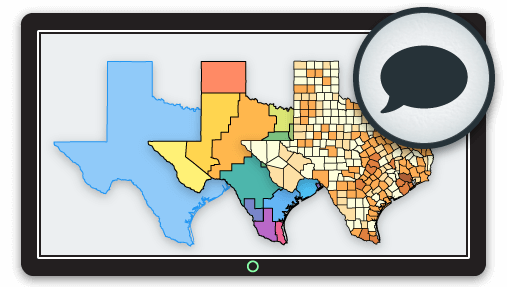
Category Maps
Category maps take data classified in a 2 or more categories and render each point or feature in a distinct color that lets us see similarly classified areas across a wide geographic area.
If you’ve ever watched election coverage, you’ll be familiar with category maps in the form of the ‘morning after’ maps, when we're presented with boldly colored graphic maps of the nation, shaded red or blue to indicate winners in each state or county.
But category maps don't end at just 2 categories - we're able to plot a wide range of categories, using color ramps that are unique across the categories, with color-blind accessible color ramp presets available - accessibility is a key ingredient for great web map visualizations.
Category maps can be used to visualize any data where there are clear classes of features, such as:
- Soil types
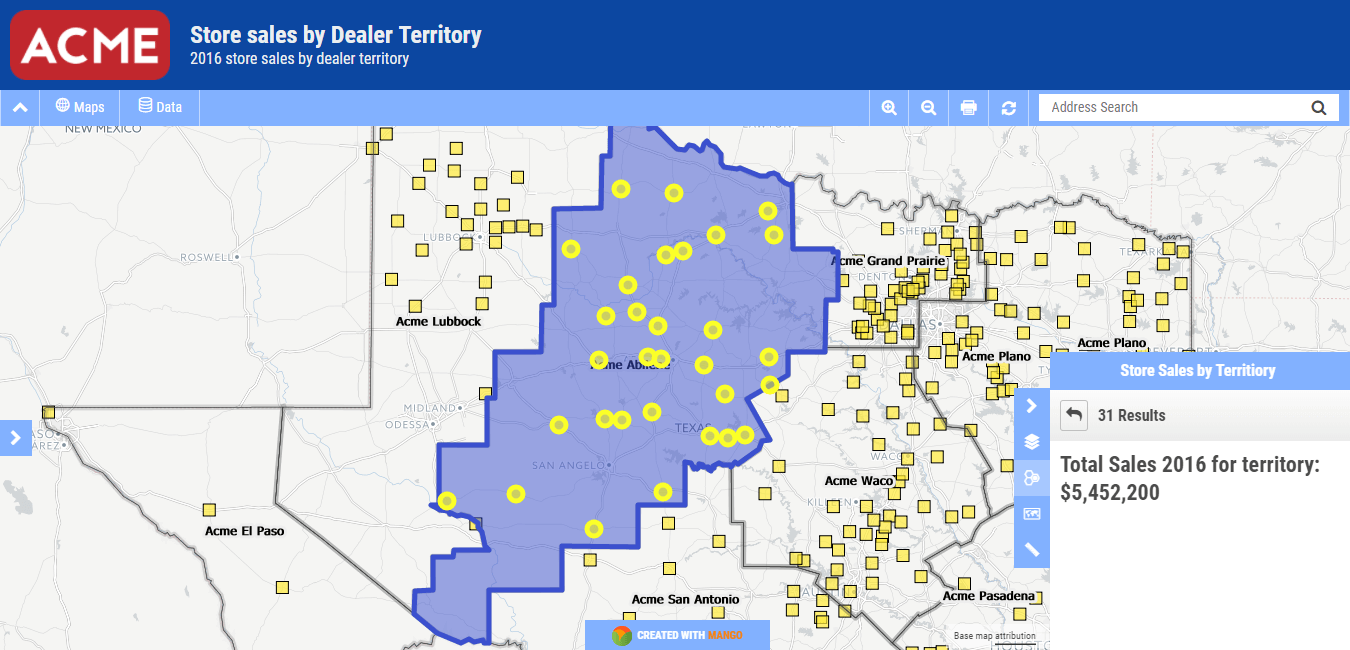
- Sales territories
- Zoning

Click to explore the interactive category webmap
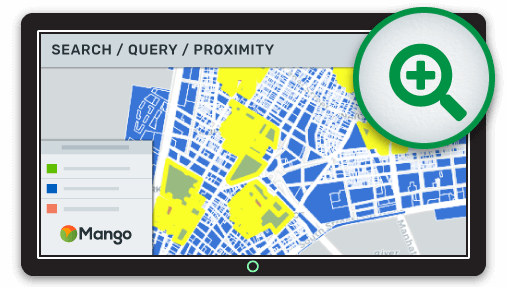
Quantity Maps
Each feature in the map above is color coded based on sales data. The darker color indicates more sales, and lighter colors represent fewer sales.
This type of map is generally called a quantity map, or if you’re feeling particularly nerdy you can also call it a choropleth map. Sometimes this type of map will be referred to as a heat map, but this is incorrect terminology. Later in the article we’ll look at heat maps.
This type of visualization is useful for identifying patterns and trends based on location, and is most often used for business analysis and demographics mapping.
Just like the category map above, this map is data-driven and uses rules based on a number “attribute” in order to style each feature.

Click to explore this interactive quantity webmap
Bubble maps
Bubble maps extend the meaning of points with differently sized circles representing values within each point. Bubble visualizations can be created from any type of data containing at least one numeric attribute.
Point, Line, and Polygon data can be reframed as proportional representations of the numerical data, represented as circles of varying size determined by the selected value. It’s common to use two layers when visualizing bubble maps from polygon data - the lower layer visualized with basic or category styling to represent the geographic area, and the bubble on the upper layer to illustrate the proportional data.
Bubble maps can be used to visualize a range of data that requires proportional representation on a web map, such as:
- Quarterly revenue from outlets or dealerships
- population size of towns and cities
- Sales growth in territories
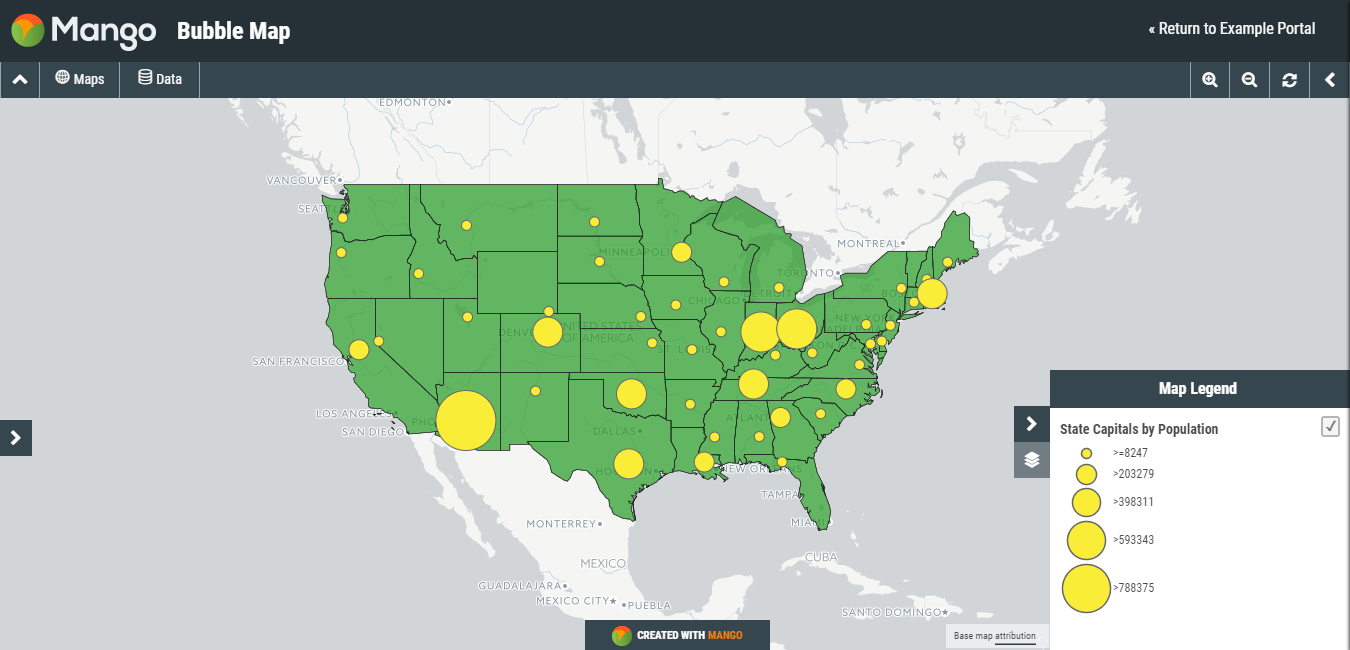
Click to explore the interactive bubble webmap
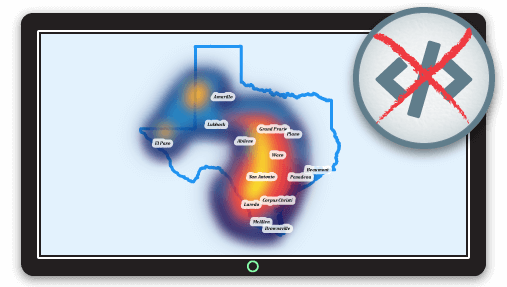
Heat Maps
Heatmaps show physical density of points, providing immediate insight into proximity and volume of data, with points in close proximity rendered in a globular gradient from yellow through reds, to lower proximity in blues and violets. Heat maps are useful to visualize datasets with a high number of points, thus reducing the visual complexity of thousands of points dotted over the map.

Click to explore the interactive heat webmap
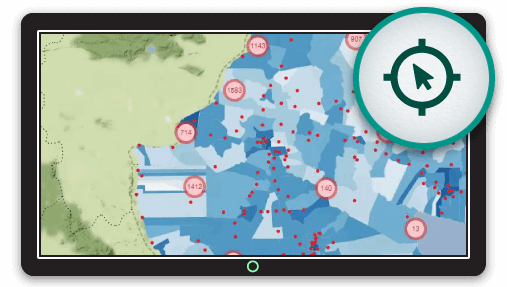
Stacking Map Visualizations
Layering different types of web map visualizations upon each other allows us to analyze and deduce meaning in ways simply not possible with tabular spreadsheet data.
A heat map visualization of customers overlaid with a series of points that indicate our dealership locations can instantly show us the dealerships that are in very close proximity to our customers, and those areas where our dealerships might have a large, but very geographically sparse customer base.
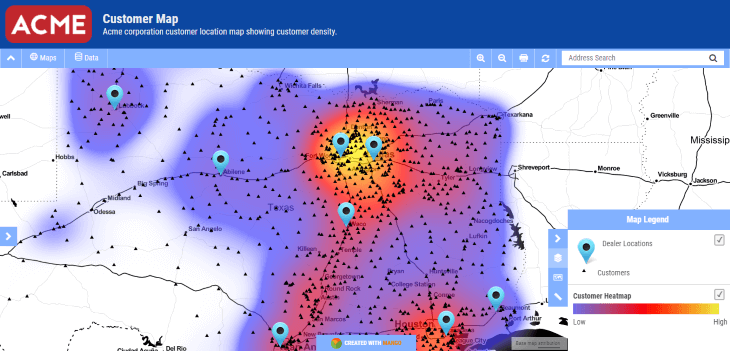
Click to explore the interactive customer webmap
Add a layer of demographic and population data in a quantity visualization, and once again we'll reveal more insight that might show us where regions have a high rate of mortgage stress which might negatively impact sales, or an increasing population of young families which could lead us to varying product choices.
We can take that knowledge and apply business solutions that bring real value to customers with improved logistics, products, and services that move with the changing face of our towns and cities.
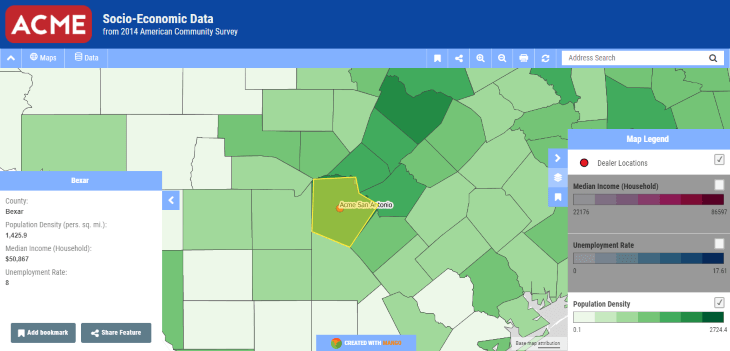
Click to explore the interactive webmap
Rather than place any limitations on your map visualizations, in Mango you can use the same dataset to create any number of visualizations, each using different attributes within the data to render informative and revealing visualizations.
A single demographic dataset could be used to create a series of map visualizations that can be layered to create a compelling web map exploring the makeup of your city or town.

Click to explore the interactive demographic webmap
The ultimate goal of mapping is to communicate and illuminate data. Be it our sales territories, national borders, how we use the land and forests, population and demographics, or mapping business intelligence to reveal opportunities and mitigate risks.
Where most businesses find incredible value is in uncovering hidden insights within existing data.
Recontextualizing your spreadsheet data with spatial visualizations in an online GIS map lets you build a resource bank of knowledge that can be shared instantly with clients around the world, or around the office.
Maintenance of these visualizations via a multi-user map and data portal within your organization that includes managers, map administrators and data editors ensures your decisions are relevant, and always based on the latest data.
There is a commonly held myth among many organizations that their data isn't suitable to be visualized on a map. The vast number of users and diverse range of people and organizations using Mango are a testament to the fact that businesses and organizations across all industries and sectors can benefit from web map visualizations.
All that is required is to start collecting spatial data. This can be achieved with minimal overheads. It’s not immediately necessary to send out dozens of minions carrying GPS and physically measuring points to get location data -- it could be as simple as recording the zip code of each customer that makes an in-store purchase.
When collated and joined with a spatial file of zip code boundaries, you can create density heat maps of where your customers live, and instantly see which areas are under-served by your existing stores.
Having hard data grounds decision-making. The choices you make need to be rooted in data truth for the greatest impact, and not made on hunches or assumptions