Web maps are all about communicating your data, but sometimes map data itself only tells part of the story. We need a way to complement and enhance that data that's quick, easy, and leads to a better experience for your users.
Like the limitations of a spreadsheet, raw map data in and of itself is lacks emphasis, which doesn't aid communication or generate interest in further exploration.
The web map customization tools in Mango allow you to not only create fantastic interactive web map visualizations, but also provide an interesting and visually impressive story that lifts your data and aides the user's understanding of the map.
Whether through instructional content that educates users about points of interest, or how to use the map to answer specific questions, or through more detailed, media rich content that provides greater context to understanding the web map visualizations.
Here's a rundown of Mango's web map customization features to help you create compelling and dynamic web map applications.
Information Sidebar
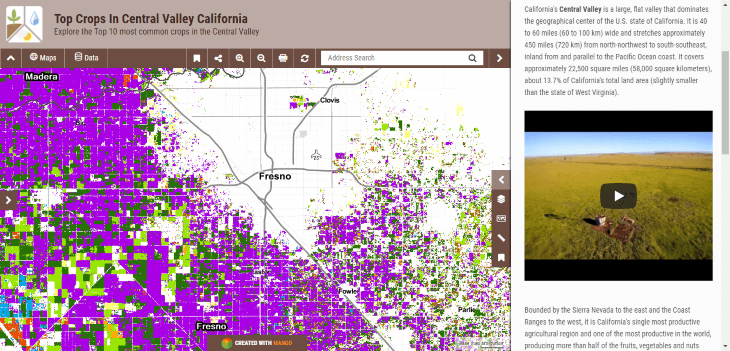
Using Mango's layout tools, you can create an information-rich web map sidebar that is completely customizable through a WYSIWYG editor that you can embed images, or video, and is available in three flavors: small, medium, and large.
When users need the full map canvas, it's just a click to slide the sidebar off-screen.
Localization & Translation
Speaking your user's language is critical to effectively communicating the story behind the map, and organizations often use specialized technical language or terminology that is specific to an industry or for internal use.
The custom language tool allows for complete localization (L10n) or translation of the map interface.
Whether you need specific terminology, or you need to translate the entire map interface into your language, the translation tool lets you customize each element of the web map interface to any language or terminology you require for your project.
Feature Popups
The map popup, or identify window in GIS-speak, is where the key information about your web map's features live. Like everything in Mango, it's designed to be simple to customize, yet powerful for delivering answers.
Mango offers three types of popups:
- Basic
- Custom
- Calculator
Basic Popup
The default popup which lists all feature attributes from each feature in an unstyled popup, much like you would see in the data table.
Custom Popup
This is the power tool for providing illuminating and attractive popups that power understanding. The custom popup offers a completely customizable WYSIWYG editor with type formatting and styling, pie and bar chart tool that lets you create charts using numeric attribute values, and even embed rich media content such as video, audio, or photos - anything media that uses an iframe embed.
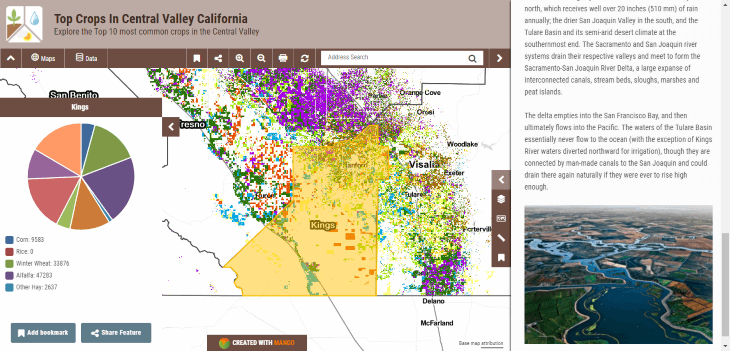
Even more powerful, you can reference online media such as photos in your dataset such as photos of features, and then Mango will detect and render those photos when users click on each feature.
Calculator Popup
If you have numerical data in your spatial dataset, you can create ready made interactive calculators that allow users to insert the own values and returns calculations based on the attribute values for each feature. Using the equations editor you can create equations that use one or more attributes combined with one or more user inputted values. Calculations can be as complex, or simple, as you require.
Every visualization layer on your web map has it's own data popup, and can be customized using any of the above three popup styles. However, if you don't need a popup for a layer, it's possible to simply turn off the popup.
Attribute Formatting
Sometimes our datasets have many columns of data. Depending on the goal of the map, it's sometimes desirable to show only specific attributes, or to hide attributes from view.
Don't want to display specific attributes? Easy. The layer formatting panel lets you toggle attributes on or off with a click.
The formatting panel also lets you create custom aliases for attributes, which is great for dealing with the sometime awkward column names in spatial data - a result of the 10 character limit for field names in the Shapefile format.
It's common to have truncated, cryptic field names like "PNT_CNT", or "RES_TYPE" in spatial data. It's a technical limitation, but in real world terms it obfuscates data and creates barriers to understanding.
In your own datasets, you'll know what this means, but for users of your map, it can be like trying to read a foreign language.
In the layer format panel, you can set custom aliases to make the meaning of attributes more clear for users when viewing data popups and filtering queries. "PNT_CNT" can become "Point Count"; "RES_TYPE" can become "Reserve Type".
Now when your users are exploring data popups, or filtering queries, they'll see natural language, not acronyms.
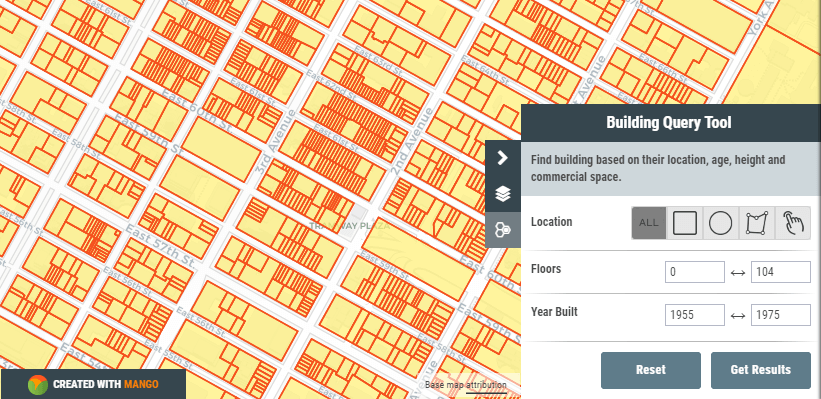
A query using field name aliases for Floors (numfloors) and Year Built (yearbuilt), providing a better experience for map users.
Data makes the most sense when in its native format. If you have numeric data that corresponds to currency, distance, area, or time, the formatting options lets you choose the appropriate prefix or suffix, providing valuable context to your attribute data popups.
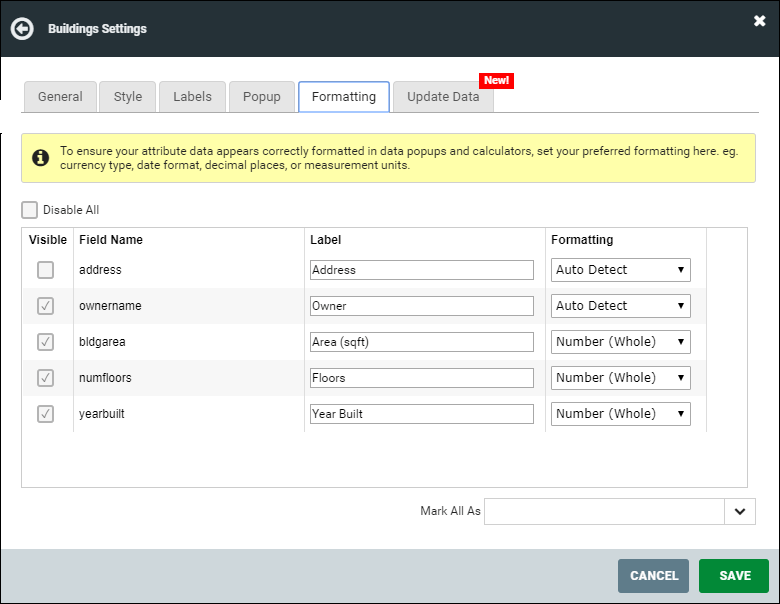 The Formatting settings for a map layer in Mango lets you set a field name alias and number formatting.
Navigation
Creating a seamless experience between your web maps and other web assets such as your organization's website or other online resources helps instill trust for your users.
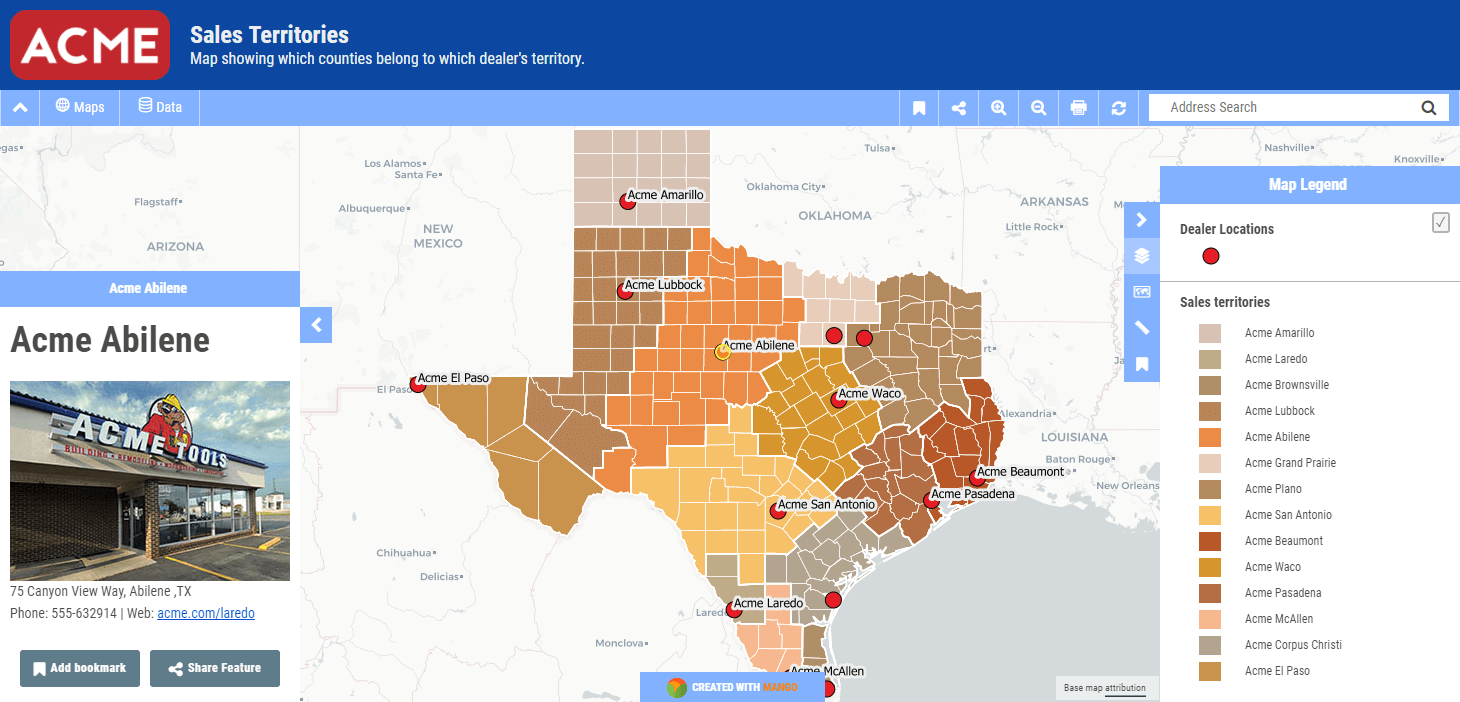
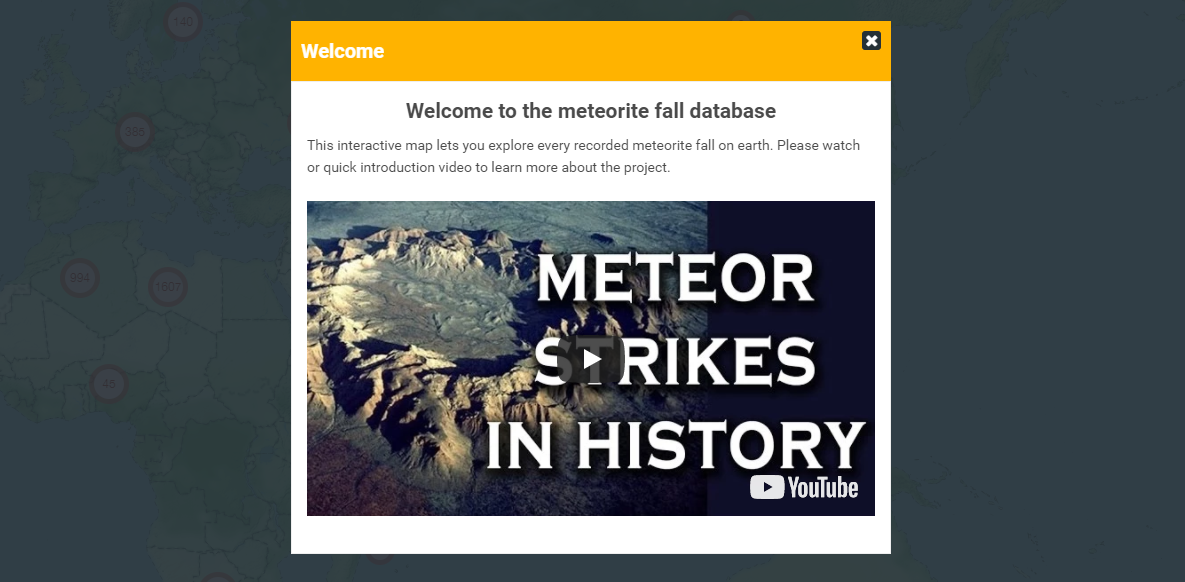
In Mango, you can create a navigation menu customized for each of your maps, with custom links, and popup modals that open when the map loads.
Menu modals can contain rich content such as embedded video or audio, and you can format the content using a rich text editor that includes image and table insertion tools.
Like all Mango features, the map customization tools can be implement in minutes with just a few clicks, and require no coding to achieve compelling results.