You created your shiny new fully featured web map, and now you are wondering how much impact is it having. Rather than relying on user feedback, wouldn't it be nice to have comprehensive and actionable data?
If something can’t be measured, then it can’t be improved. In this article I'm going to show you how you can use analytics systems to answer questions that gauge the success of your web maps.
Questions such as:
- How many people are viewing my map?
- How long are they using the map for?
- Where are the map visitors located?
- Where in the map are the viewing most frequently?
These questions and many more can be answered using third party analytics platforms. After reading this article your will be up to speed on the two leading options when it comes to tracking your web maps. Google Analytics (free) and Maptiks (paid).
Google Analytics

Google Analytics is a massively popular analytics tool on the web, and is the default choice for all web designers. It is currently used to collect traffic data for over 50% of all websites on the internet.
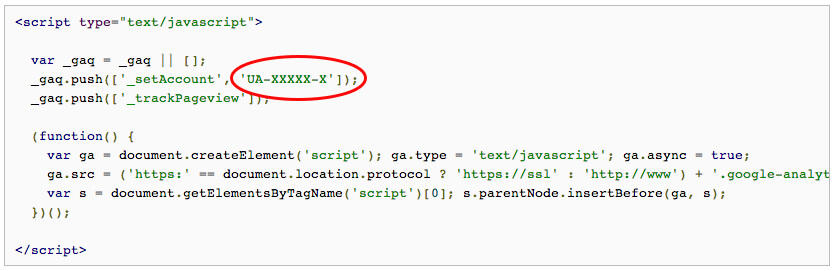
Google Analytics is a free tool and is simple to use. All you need to begin is insert a small snippet of tracking code on each page of your website, or in our case on each map.
Once installed you will begin seeing data in near real time and can view aggregate data for any period of time across all maps, or individual maps.
The key metrics tracked using Google Analytics are:
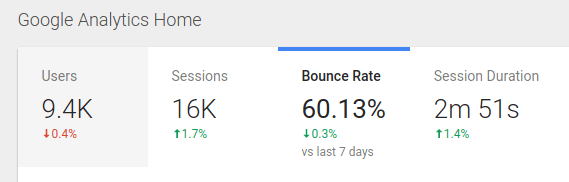
Users
This is the total number of unique visitor to your site. When users visit, Google places a cookie in their browser, so next time they come they can detect if they are a new or returning visitor.
Sessions
The is the total number of times your site was visited and interacted with. This number is usually larger than users, as a single user might have had multiple sessions during the time period you are reviewing.
Bounce Rate
A bounce is when a user visits a single page your website (or map portal in this case) and leaves without visiting another page. For normal websites, a high bounce rate can indicate that the user hasn't found what they are looking for.
This metric is less relevant to maps as the map is a single page, and whilst using that single page the user can perform lots of different actions.
Session Duration
This is the average time that users spent on the site/maps. This metric is much more important for web mapping than bounce rate. A high average time on site would indicate that users find your map useful and stick around to use lots of features.
In addition to these key metrics there are dozens of other data points that can be viewed, such as the user's location, which device they are using to access the map and which website the user came from before viewing your map(s).
This data is often actionable and can be used to assess the impact of any changes or updates you have made. For example, an increase in average session duration would indicate that your maps are becoming more useful, or an increase in the number of visitors could indicate that marketing efforts are bearing fruit.
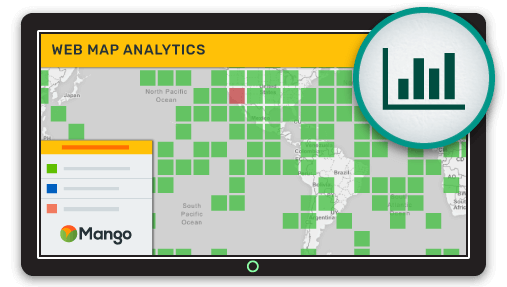
Maptiks
![]()
Maptiks is similar to Google Analytics and offers many of the same data points, but unlike Google Analytics, Maptiks was designed specifically for web maps and gives you access to some map specific metrics.
Metrics such as:
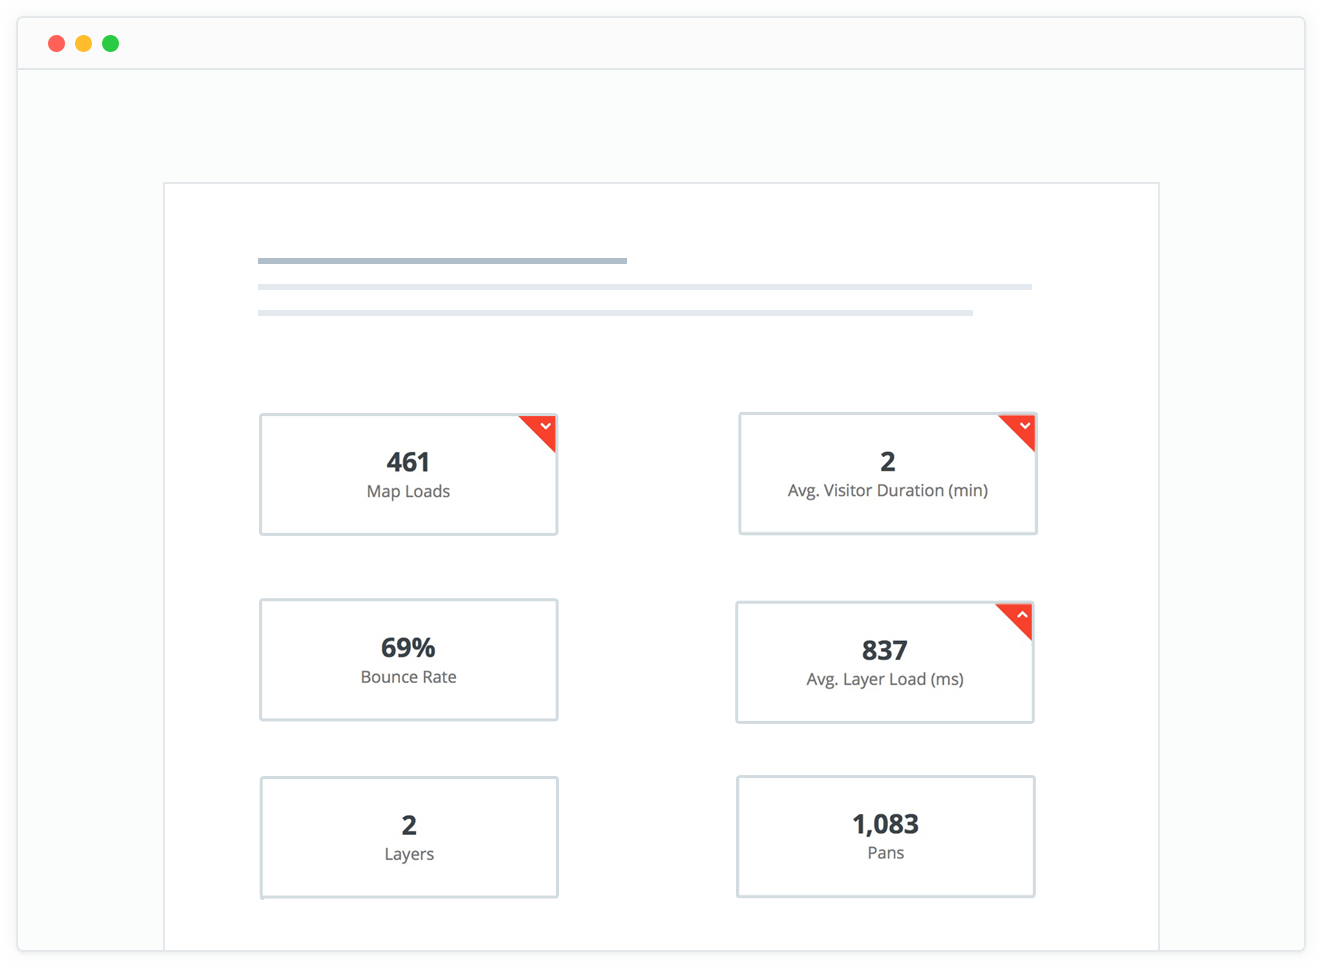
Pans / Zooms
This allows you to see how active the user was on the map. A high number of pans and zooms indicated high levels of engagement.
Layers
See how many individual layers the user viewed during the session.
Activity
The number of clicks and queries the average user made during their session.
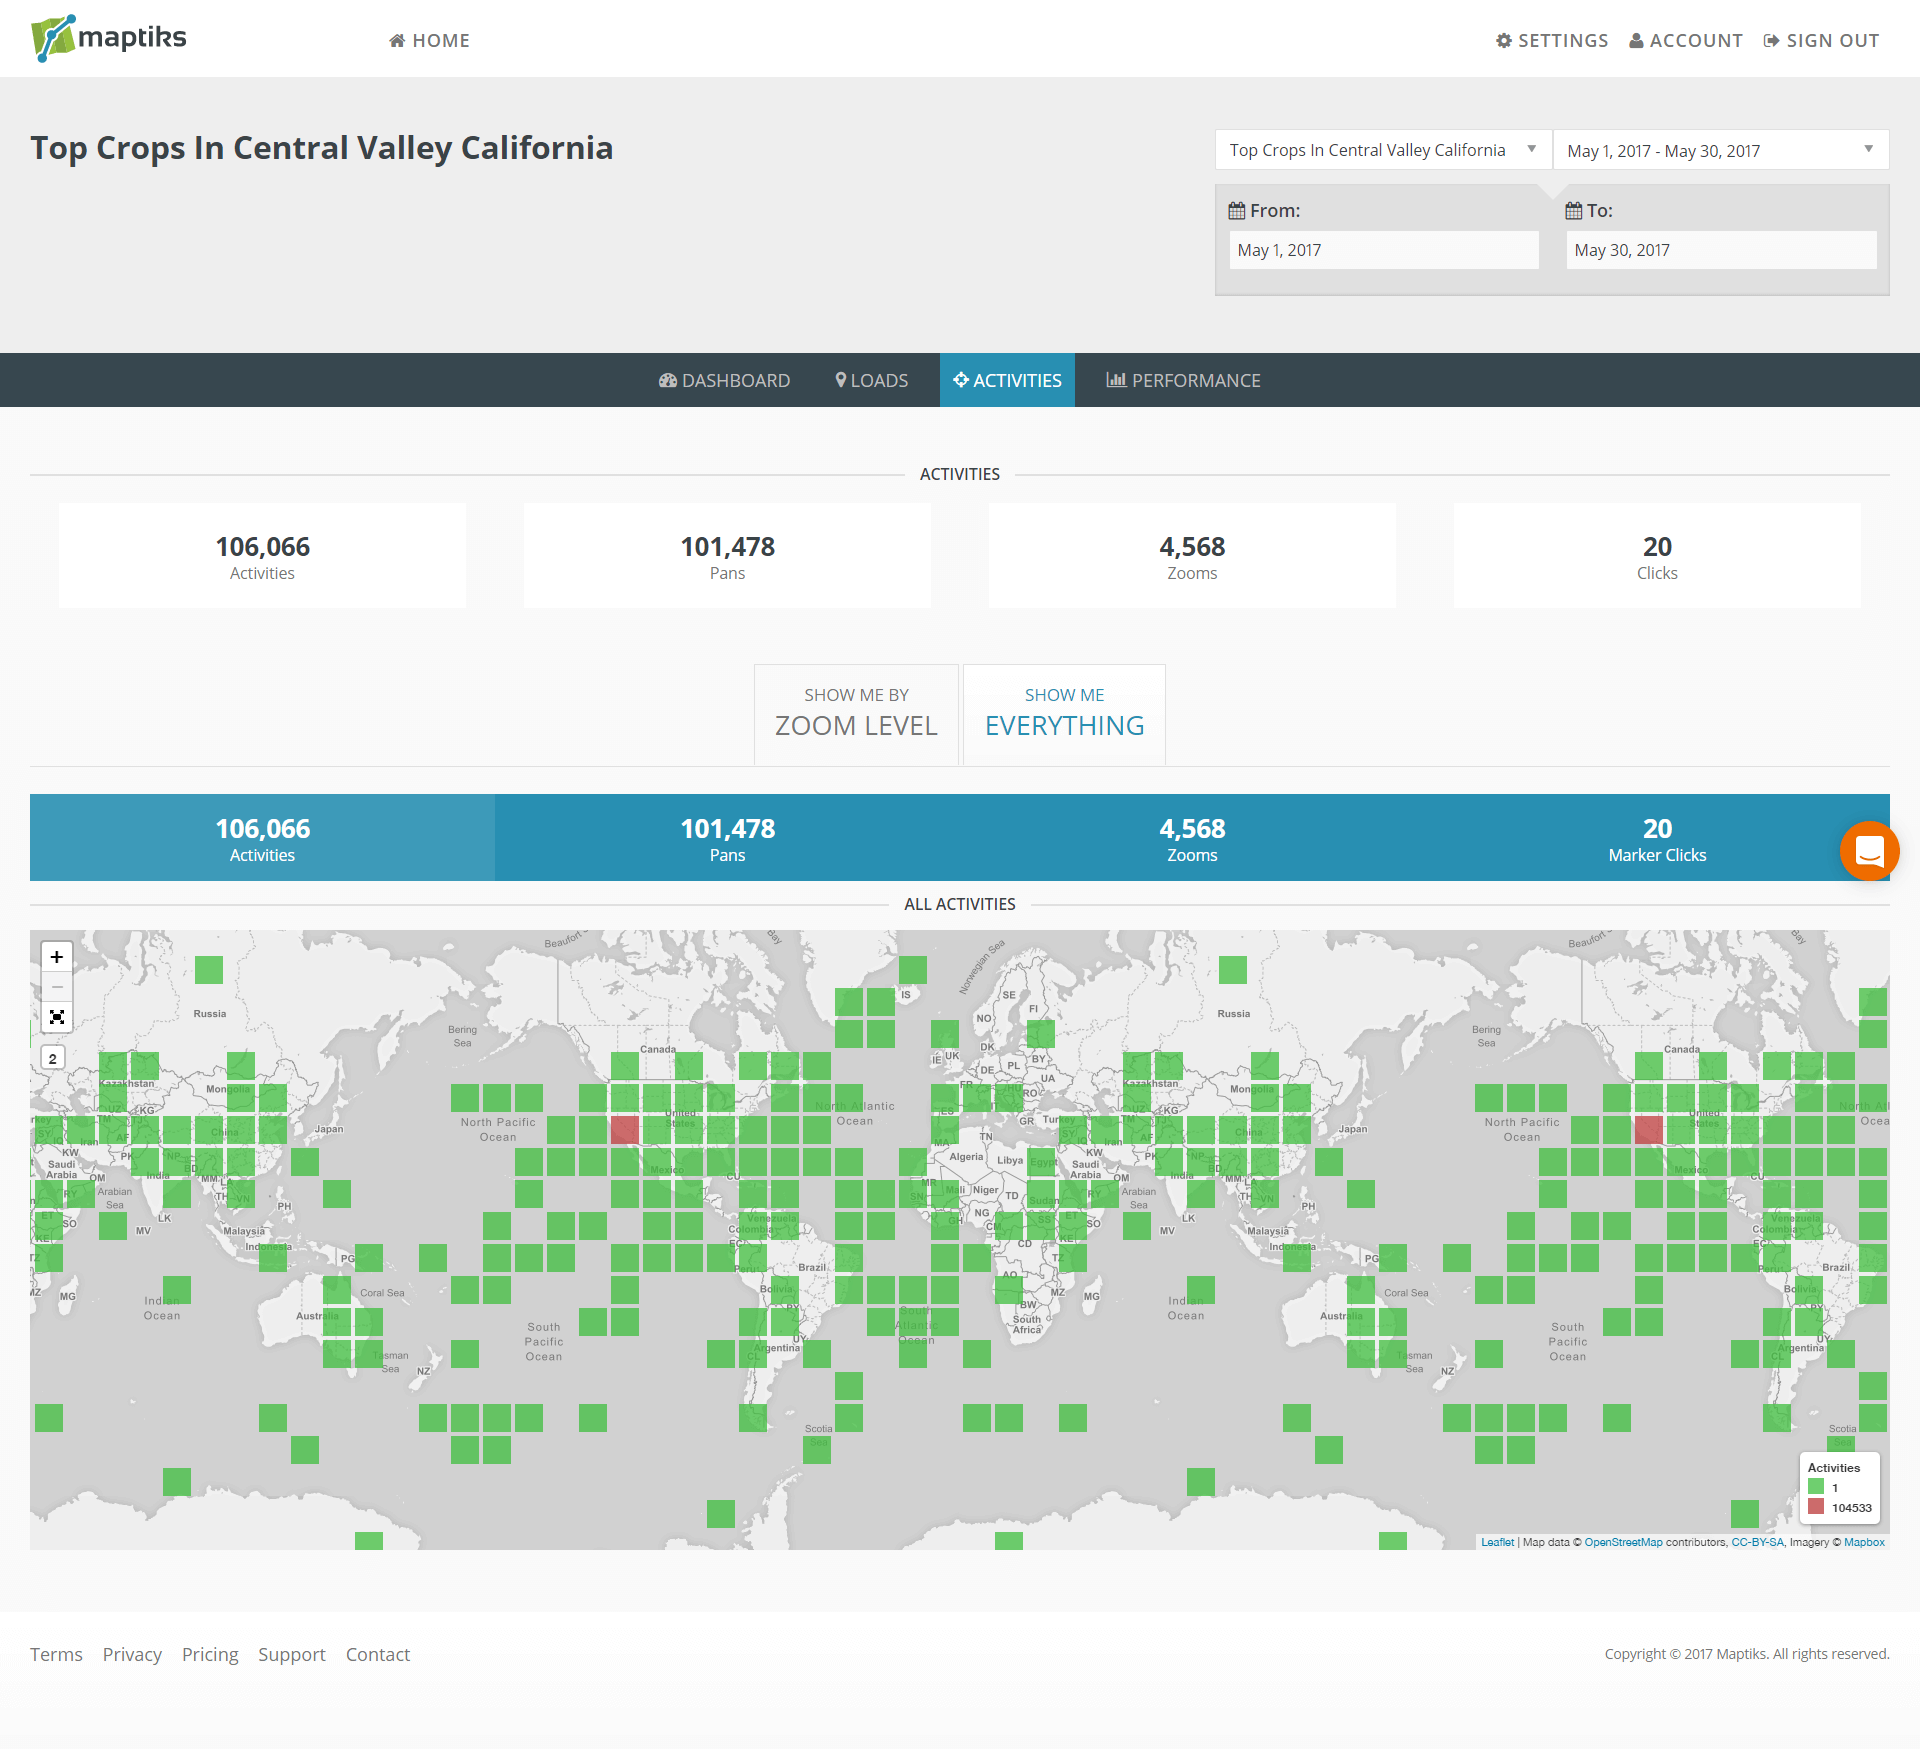
Activity Heat Map
See the areas on your map which had the most activity (pans, zooms, clicks). This will allow you to quickly build a picture of the areas within your map that are of most use to your users.
Maptiks Benefits
Unlike Google Analytics, Maptiks is a paid service with plans starting from $39 per month. If you are investing heavily in your web mapping system, it's a sensible investment as it will give you a much clear picture of how your maps are performing and how they are being used.
Configuring Google Analytics or Maptiks Using Mango
Setting up Google Analytics or Maptiks in Mango is very simple. All you need is a Mango account, a web browser and a tracking code from Google or Maptiks then everything can be setup with just a few clicks.
As with all Mango features what you won’t needs is:
- Any programming skills
- A server
- Expensive software licenses