Are Your Users Tired Of The Dated Imagery In Your Web Maps? Learn How To Breath New Life Into Your Maps With Fresh Imagery.
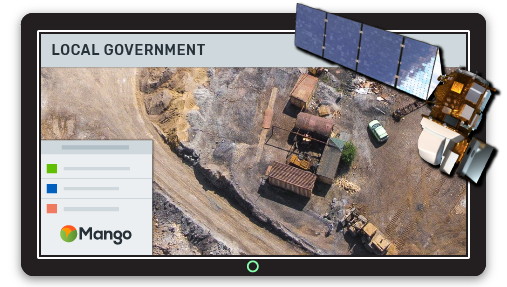
Up-to-date imagery could provide huge benefits to you countyf, city or township for applications as diverse as identifying new structures or identifying illegal activities such as dumping. Sadly, such up to date imagery is not readily available in a web platform that can be shared across the organization and the public.
Most online GIS offer a choice of “basemaps” which are usually pretty looking images that provide a seamless view of an area, usually to provide context to other map layers. However, the process of generating such basemaps involves a lot of heavy lifting and the basemap providers may have content that is a bit out of date.
So if you are the GIS manager for a county, city or township and need up-to-date imagery for your web maps, what are your options?
Your first port of call might on a provider of bespoke basemap solutions which you can pay to subscribe to.
The second scenario is where you have acquired imagery from a local or regional provider of aerial imagery from an airplane or drone. In such cases, the imagery is usually delivered in a standard geospatial file format which is easily viewed in a desktop GIS environment.
But how do you get this content into your web GIS?
The first thing to check is that your data contains coordinate system information.
Even though your data is likely projected to a local coordinate system e.g. State Plane Zone x, it’s important to ensure that the coordinate system information is stored in the header of the image since a conversion to the Web Mercator coordinate system, the de-facto standard for Web GIS, will be necessary.
The easiest way to check this is to open your file in a desktop GIS such as QGIS and check the properties of the file.
The next thing to check is whether your file is in a format that is recognized by common image handling libraries out there. Proprietary formats or formats that contain proprietary compression algorithms (e.g. MrSID) might lead to problems. The most common uncompressed formats out there that are easily read are
- .tif (with GeoTIFF header embedded)
- .bil (band interleaved by line)
- .img (ERDAS Imagine format)
- ENVI .hdr raster
Note that we are not particularly concerned with compressed formats such as .jpeg or .jp2, as in the end, the images will be served up as uncompressed image tiles in the Web GIS.
TIF is probably the most common format as it is an open format, providing truly independent support from proprietary software. However, there are several TIF flavors to be aware of;
- TIF - Plain old vanilla TIF files. These don’t contain any geolocation information embedded in the file and are typically have an accompanying world file (.tfw or .wld) which tells the software where to draw the data, but not the coordinate system (which can lead to problems with Web GIS).
- GeoTIFF - contains geolocation and coordinate system information embedded in the .tif file, making the this more portable and flexible than regular TIF.
- BigTIFF - Both TIF and GeoTIFF have a file size limit of 2Gb (which is not very much these days) something that is overcome by BigTIFF. Not all software supports BigTIFF, so you might find your data has been cut into 2Gb tiles, but if you have a BigTIFF and a modern GIS are one step ahead of the game as there are less files to handle.
Final Checklist before upload to a WebGIS
1. My data has a coordinate system defined
2. My data is in a common file format
3. Good to go!
If your data does NOT meet these criteria, consider converting the data using your existing GIS tools or use QGIS, which has excellent image conversion tools.
What’s Changed?
In any imagery, there is a going to be a fair amount of land area that has remained unchanged and a smaller amount that is change. Quickly identifying the change is key to efficiently assessing large areas. One the the best way to do this is to have two image dates on hand; either two sets of files from an imagery provider or a basemap plus a recent dataset.
By adding the data to a web GIS, we can create a layer containing each image date and add a slider to compare the two images visually. Adding context to the image e.g. parcel boundary with a parcel ID label allows you to identify the relevant property and decide on further action e.g. physical inspection. And of course the beauty of web maps is their simplicity and ease use; anyone in your organization with a web browser can find the change and print a map with the relevant information displayed on top of the update imagery.
Imagery Sources:
Drones vs. Planes vs. Satellite
There are a plethora of imagery options out there from drones to satellite with multiple companies jostling for attention in the space. So how do you choose which imagery source to go with?
The first thing to note is that resolution is not the be all and end all of the story.
Sure, it might be cool to examine the gnat sucking blood from your neighbor’s balding dome in a drone image, but how scalable is that?
The basic rule of thumb is that resolution (the smallest object that can be seen in an image) comes at the cost of coverage and also dollars. Therefore, there has to be a tradeoff between those factors; you can’t have the whole county imaged at 2 cm from a drone every month!
In a nutshell, here are the best applications for each platform;
-
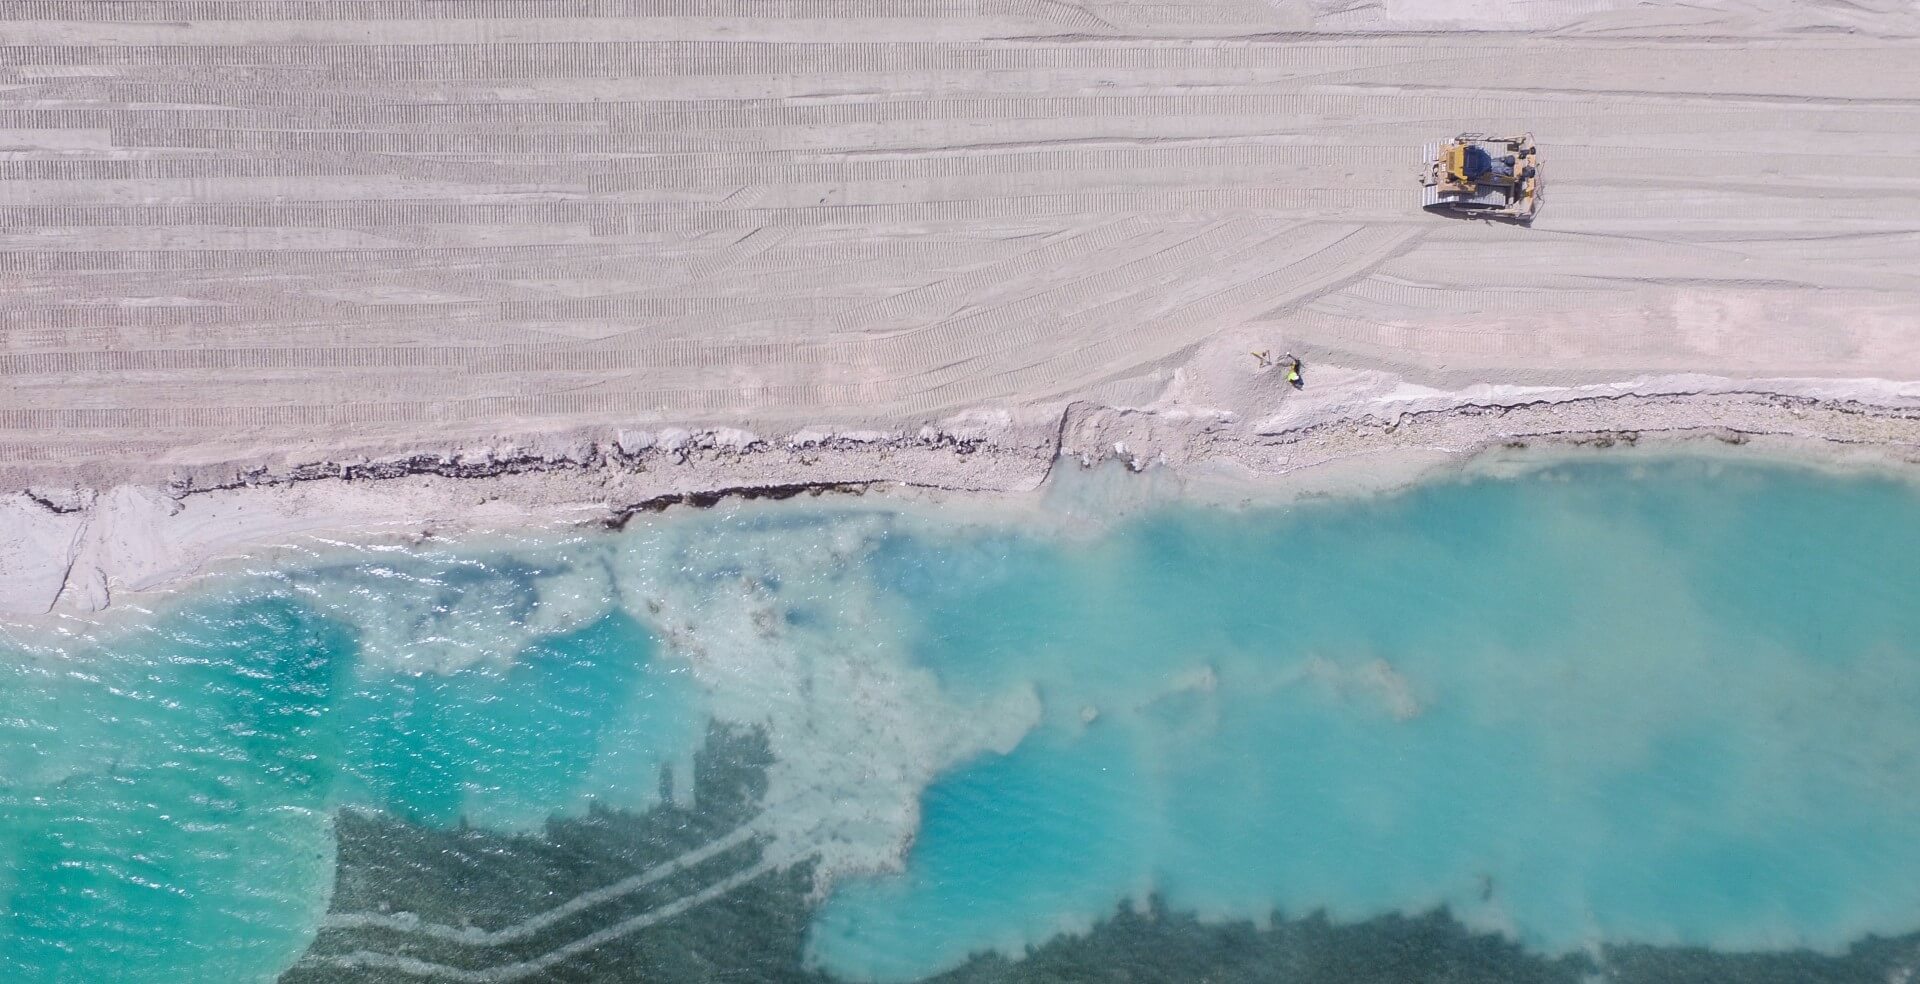
Drone - good for smaller areas that may require frequent updates, e.g. a construction site, quarry or farmers field. Easy to deploy, quick to deliver, relatively inexpensive for small areas.
-
Aerial - a number of companies fly imagery speculatively, which you can buy “off the shelf”. Ideally, imagery is typically < 1 year old and often is targeted at populated places. If you have a bigger budget, you can also contract aerial survey companies to deliver imagery to your own specification.
-
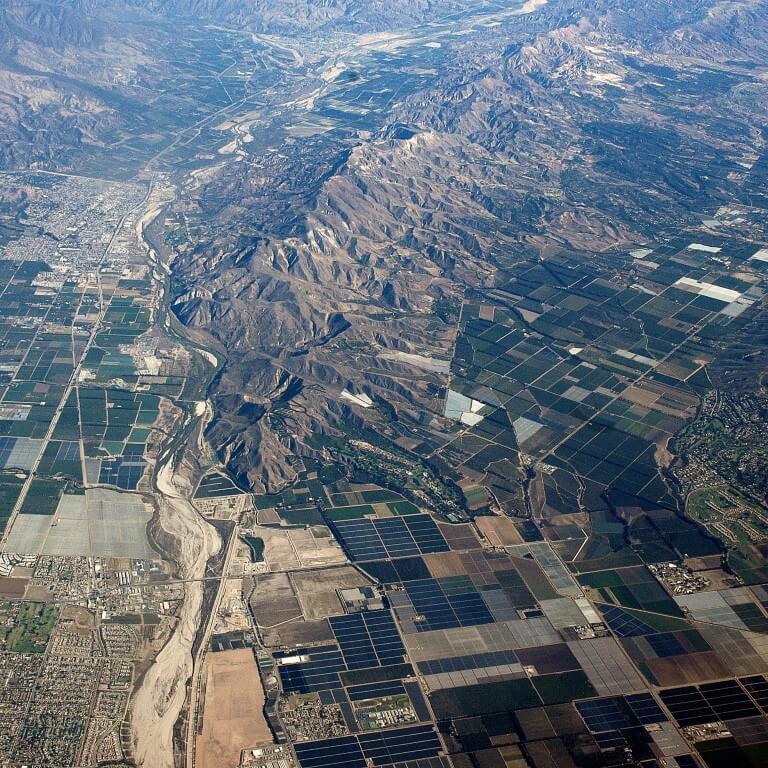
Satellite - two main players - DigitalGlobe and Airbus dominate the “Very High Resolution” market with imagery down to 30cm resolution. However, there are literally dozens of sub-meter satellites being launched, so the cost of data should be coming down. VHR satellite imagery is ideally suited for larger areas including rural and remote areas. The currency of the data usually depends on population density; cities are likely to be imaged several times a year, rural and remote areas maybe annually or bi-annually.
Mango - the Fastest Way to Get Your Imagery and GIS Data Online
Ready to start creating stunning web maps incorporating your imagery and GIS data? Here are five reasons why you should choose Mango
- Direct upload via our web interface; no need to pay for desktop software to handle the upload
- Game changing pricing for raster data storage, starting at just $50 for 50 GB
- Support for really big file uploads
- Share your maps privately or publicly - the choice is yours
- Create beautiful vector overlays on top of your raster data
Ready to get started? Sign up now.