Background
Sitting at the intersection of the Red and Assiniboine rivers, Winnipeg is the capital city of Canada’s Manitoba province.
In 2020, Professor Joyce Slater of the University of Manitoba’s Department of Food and Human Nutritional Sciences wanted to analyze Winnipeg’s socioeconomic data cross-referenced with food and nutrition resources across each neighborhood - everything from grocery stores to food banks to community gardens.
 The goal: to spark wider conversations about the challenges faced by residents living in areas identified as “food deserts” while finding potential hotspots for downstream health consequences related to a lack of nutrition.
“Poor nutrition and food insecurity are major issues for Winnipeg. But we haven't really had good information to have a real evidence-informed conversation about how this is affecting our community,” Professor Slater told Canada’s CBC News.
To enable wider, more interoperable access to detailed information and spark these evidence-driven conversations, Professor Slater set about visualizing the relevant datasets in an engaging, interactive online map that could be shared, queried and analyzed by anyone with a web browser and internet connection.
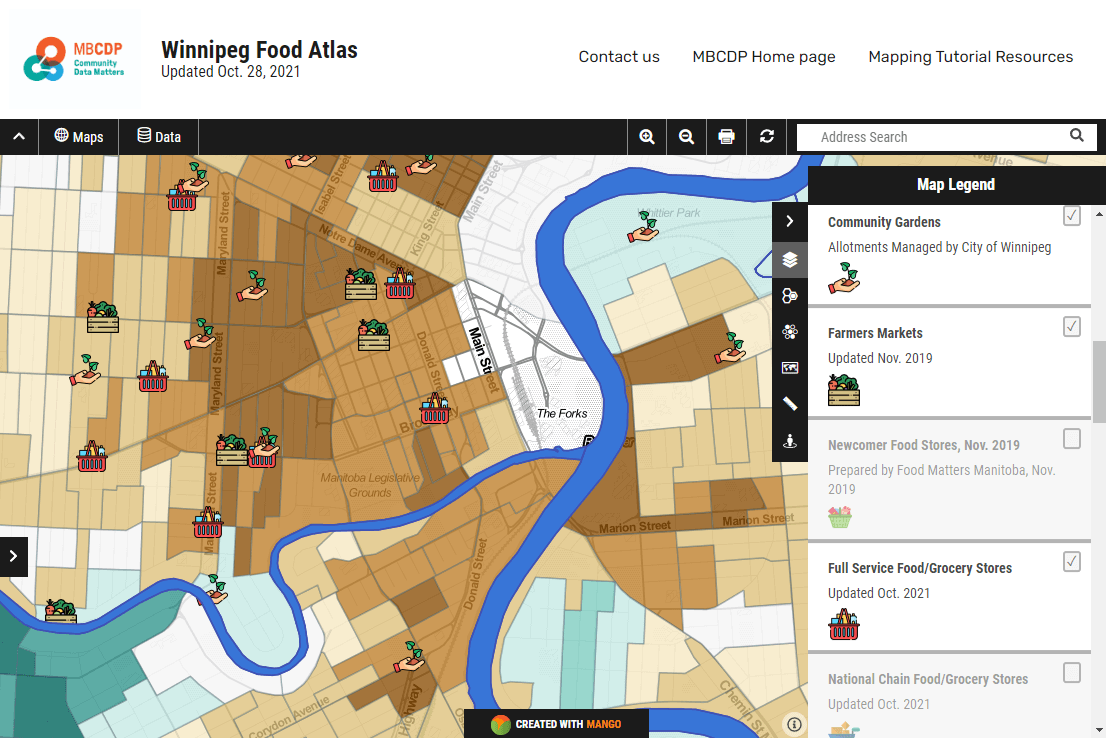
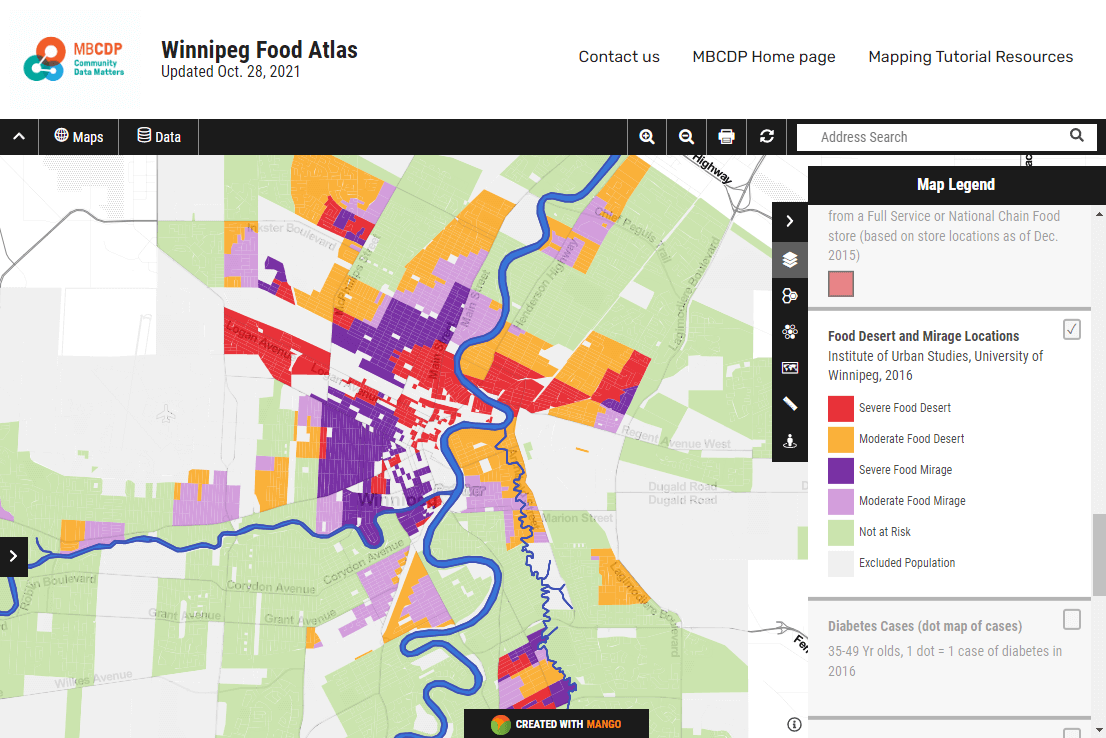
The result - The Winnipeg Food Atlas:
The Problems Mango Solved
The Winnipeg Food Atlas was launched in 2020 using Mango as the underlying web mapping software. Professor Slater was able to blend a broad swath of datasets related to Winnipeg’s food and nutrition security cross-referenced with socioeconomic factors like median household income, life expectancy, diabetes rates, and immigration status.
The Atlas was then labeled, scored and color-coded to identify areas identified as “food deserts”, shown in the Atlas as red. A food desert is defined as a neighborhood without adequate food options within a set vicinity, set at half a kilometer in the Atlas.
"The number one challenge is there are too many people with not enough income or money to be able to afford healthy food," Professor Slater added, referring to a pattern in the map showing lower-income neighborhoods being over-represented in the food desert category.
On a technical level, a significant challenge was the sheer volume of data that had to be combined, layered and made available in an engaging, visual way that the majority of end-users--even those who were non-technical--could navigate and compare for insights.
It’s here where Mango’s powerful search and query functionality, along with its intuitive point-and-click features and filters, enable end-users to access the story beneath the data in a fast, straightforward manner. Each map layer can be switched on or off and every dataset clicked to access a pop-up window with a detailed report. The color code grades also offer an instant view of every food desert (highlighted in red) along with a broad selection of accompanying data points for context.
As a result, the Atlas enables a multivariate analysis of every neighborhood by combining important socioeconomic variables, such as an area’s average income, cross-sectioned with geographical proximity to grocery shops and other food resources - all easily accessible for users of all technical levels.
Results
The Winnipeg Food Atlas received national press attention and has become a key resource for predicting potential future health outcomes for the residents of Winnipeg.
The Winnipeg Food Atlas has also highlighted the key finding that areas with lower food security tend to also have lower nutritional scores and higher diabetes rates. According to Professor Slater’s team, this compendium of factors potentially foreshadow significant downstream consequences for the city’s residents and healthcare sector in the years to come, potentially to the tune of more than $1 billion on diabetes-related healthcare costs alone.
“The main issue is that "without [...] information [around food desserts around the area], it's really hard to start talking about preventing [related health issues] and coming up with solutions," Professor Slater added.