COVID-19 CRISIS: ATLAS OF COMMUNITY RESILIENCE
Modelling the Potential Impacts of Covid-19
The global outbreak of Covid-19 is spreading rapidly and could have a lasting impact on our lives. How can we anticipate its potential effects and strengthen the resilience of our most vulnerable communities?
Resilience is our ability to absorb unexpected and expected shocks, adapt, and continue to thrive.
The Atlas of Community Resilience visualises where and who are the most vulnerable using spatial and multi-criteria analysis to simulate the potential impacts of Covid-19 in Malaysia. This tool hopes to help users swiftly comprehend the complexity of impacts by overlaying multiple dimensions of socio-economic-health data to profile site-specific vulnerability (urban, peri-urban, rural) and identify under-supported vulnerable communities.
This tool draws upon selected vulnerability indicators that were chosen through observing economic, social, and medical needs published in research articles, broadcast in media, as well as through discussion with local experts.
The Atlas aims to contribute to the development of national, state, and local response strategies that increase the resilience of vulnerable communities in Malaysia through effective resource allocation.
The Atlas was last updated in May 2020, during which district-level cases were last released to the public.
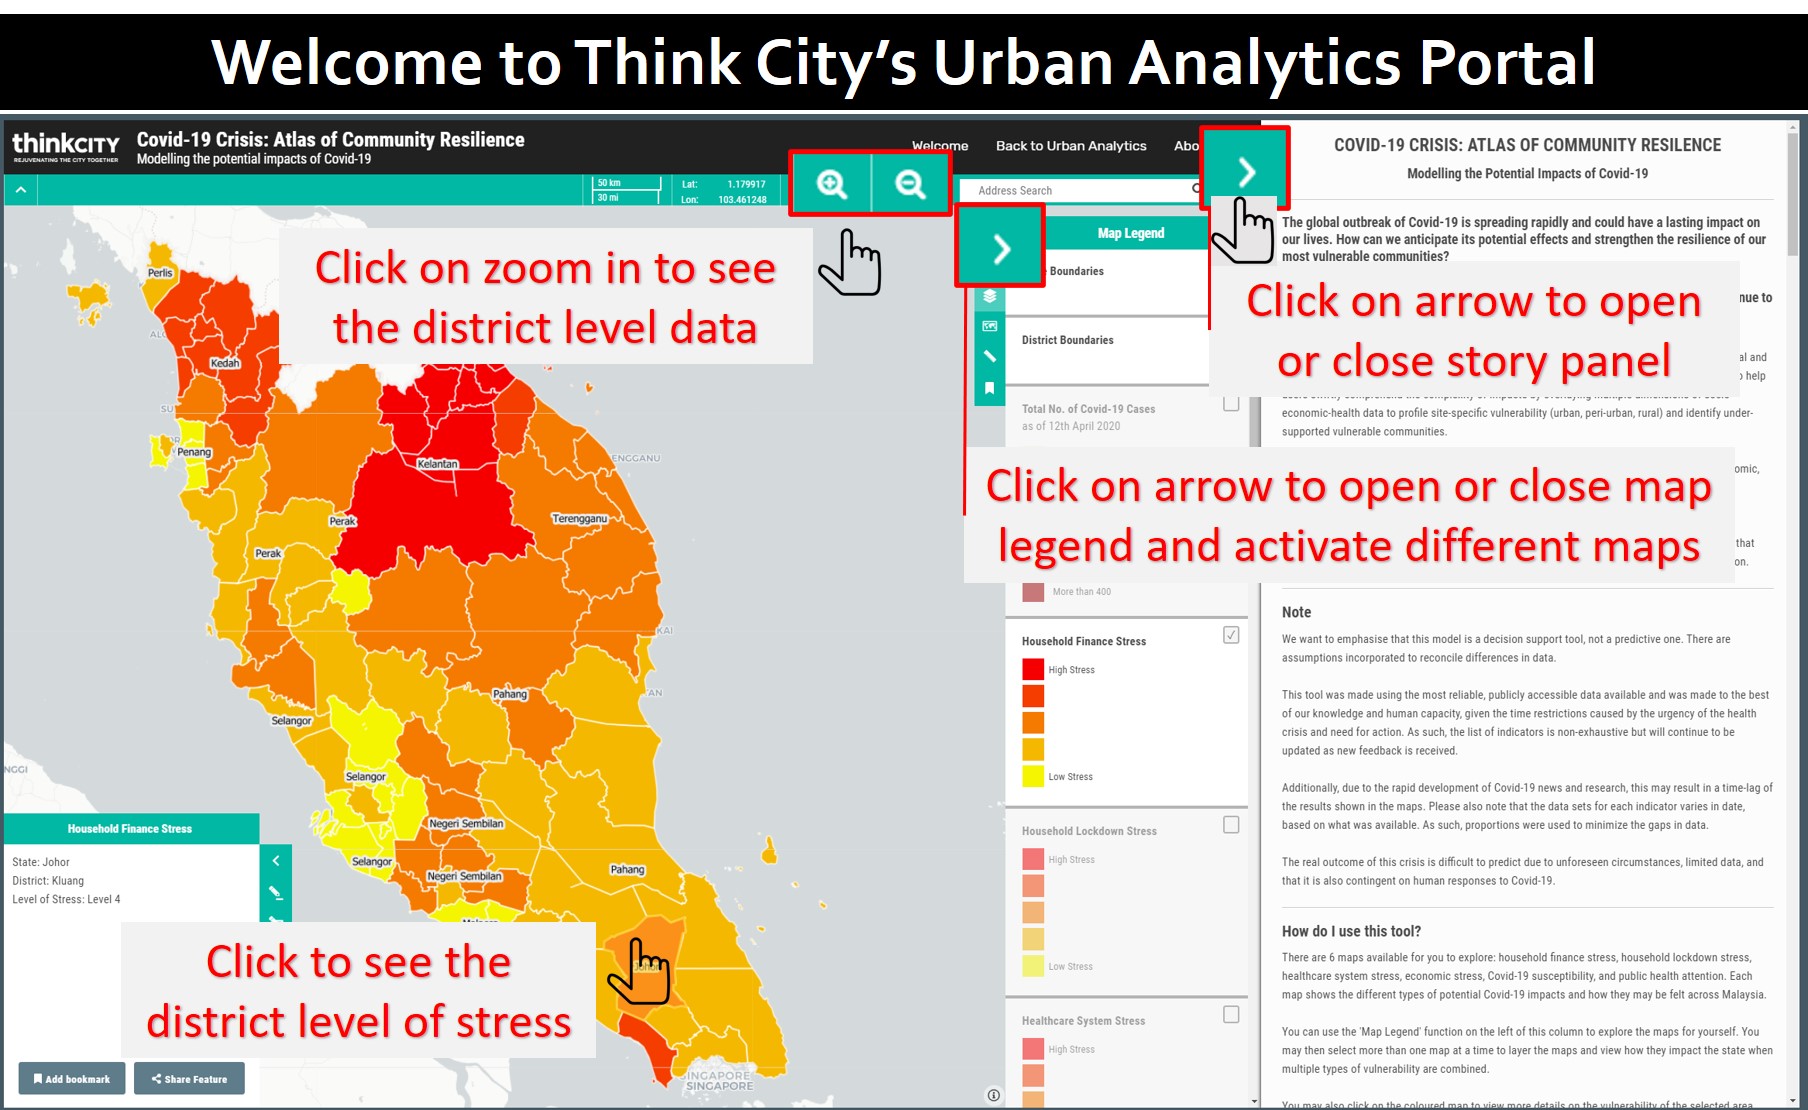
How do I use this tool?
There are 6 maps available for you to explore: household finance stress, household lockdown stress, healthcare system stress, economic stress, Covid-19 susceptibility, and public health attention. Each map shows the different types of potential Covid-19 impacts and how they may be felt across Malaysia.
You can use the 'Map Legend' function on the left of this column to explore the maps for yourself. You may then select more than one map at a time to layer the maps and view how they impact the state when multiple types of vulnerability are combined.
You may also click on the coloured map to view more details on the vulnerability of the selected area. Additionally, please use the 'zoom in' function on the top panel to have a closer look at the information on a district level.
Note
We want to emphasise that this model is a decision support tool, not a predictive one. There are assumptions incorporated to reconcile differences in data.
This tool was made using the most reliable, publicly accessible data available and was made to the best of our knowledge and human capacity, given the time restrictions caused by the urgency of the health crisis and need for action. As such, the list of indicators is non-exhaustive but will continue to be updated as new feedback is received.
Additionally, due to the rapid development of Covid-19 news and research, this may result in a time-lag of the results shown in the maps. Please also note that the data sets for each indicator varies in date, based on what was available. As such, proportions were used to minimize the gaps in data.
The real outcome of this crisis is difficult to predict due to unforeseen circumstances, limited data, and that it is also contingent on human responses to Covid-19.
How can this tool help?
- To help raise awareness, understand, and deal with the complexity of impacts.
- To identify vulnerable hotspot areas and under-supported communities.
- To help inform national, state, and local response to Covid-19.
- To help develop strategies that strengthen community resilience to the impacts of Covid-19 over the short and long term.
- To help link global and local relief, as well as mobilise communities.
How did you make this tool?
The methodology used gathers publicly available data to measure and map the potential impacts of Covid-19 on the Malaysian population. This approach was used to acknowledge the wide range of impacts that is likely to occur during and after this period of crisis.
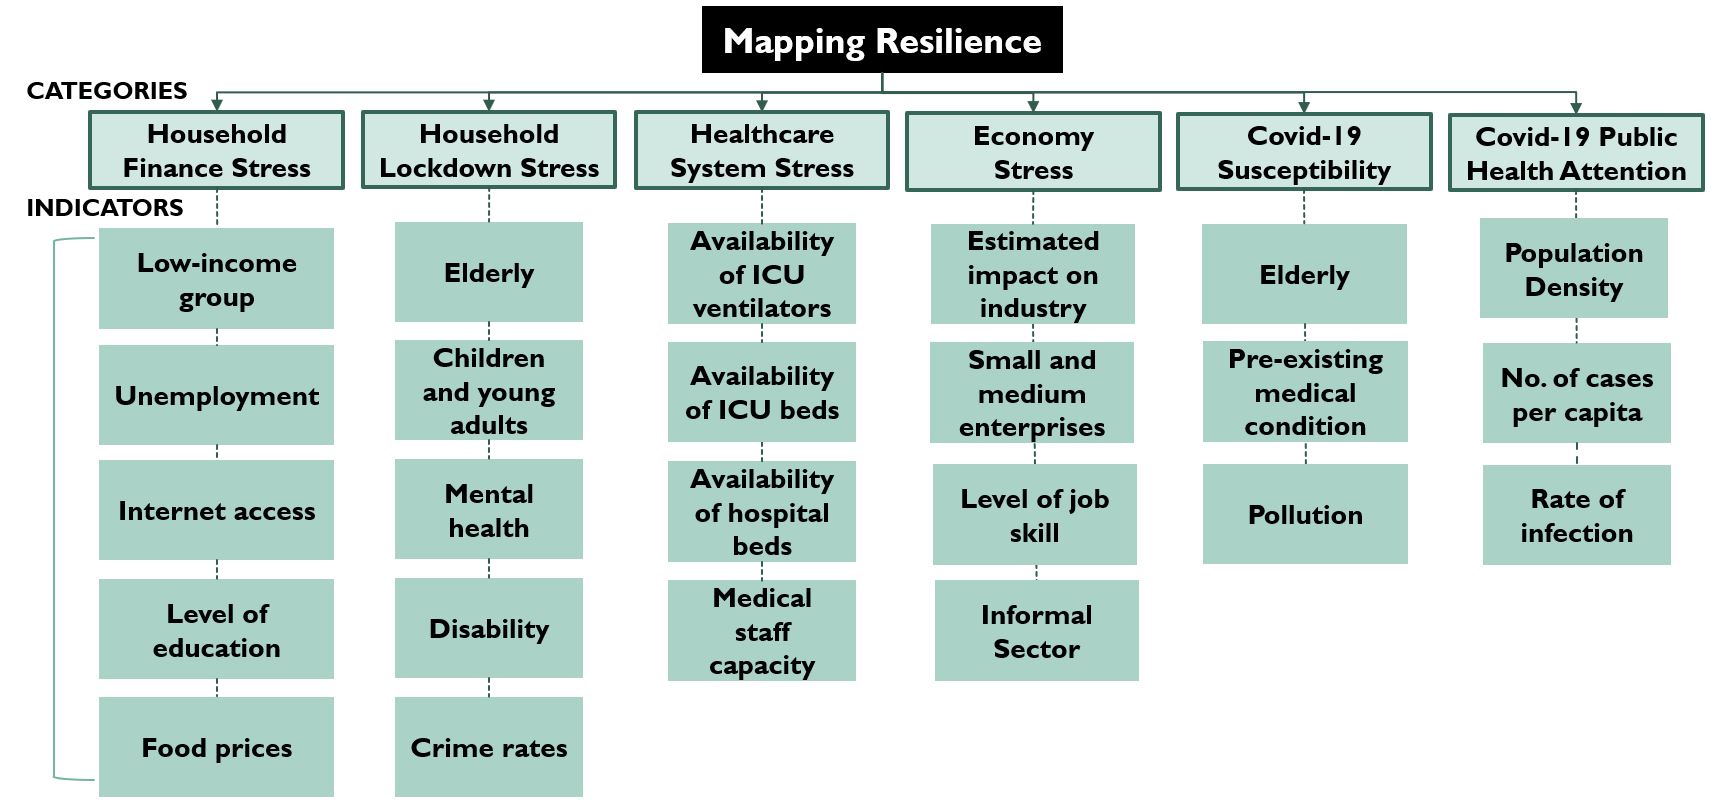
Six categories of resilience were chosen and measured by their relevant indicators. Indicators were chosen through observing the global effects and responses to Covid-19, as well as Malaysia's own situation. Local experts, with backgrounds ranging from finance, government to health, were also consulted and asked to weigh the different indicators based on level of importance. The most updated and reliable data sets were used for the indicators e.g. the proportion of the elderly population was sourced from Malaysia's Department of Statistics. The results simulate what parts of Malaysia are most vulnerable to the impacts of Covid-19.
Although this tool measures a number of factors, due to the time restrictions caused by the urgency of health crisis and limited data, the list of indicators is non-exhaustive. We hope to continue updating this tool with new research and news. This tool is not a model, but a simulation of what parts of Malaysia are less resilient to the effects of Covid-19, from health to economic impact.
Figure 1. Six main categories and their relevant indicators used to simulate the overall impact of Covid19.
Think City Key Findings
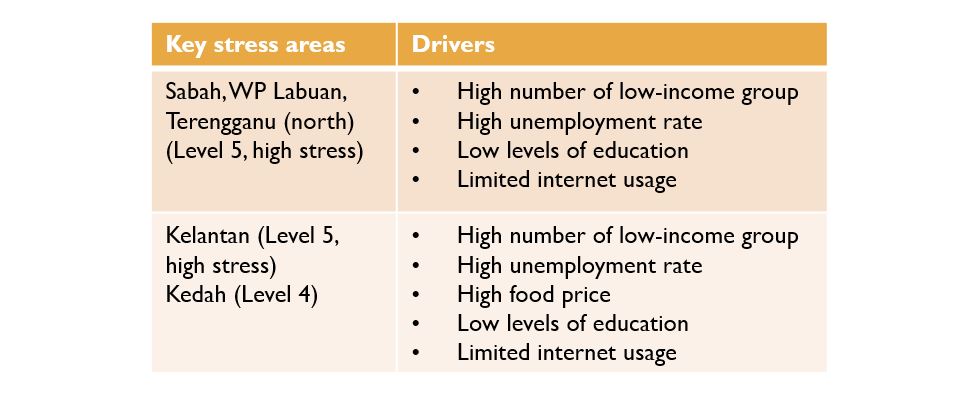
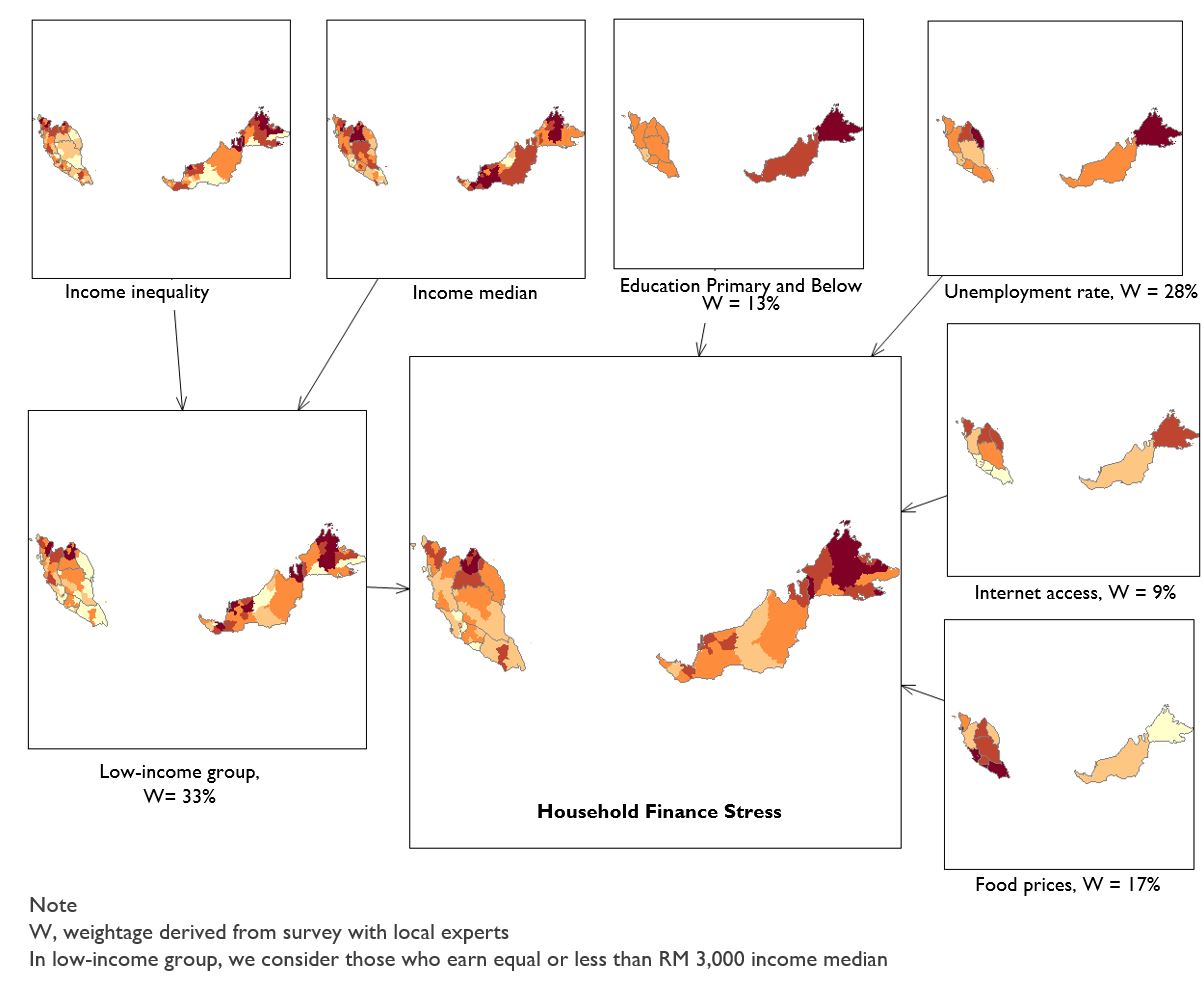
1. Household Finance Stress
The table highlights areas where households are likely to experience economic stress as a result of a higher proportion of the population with low-income levels, higher rates of unemployment, higher food prices, lower levels of education, and lower access to the internet.
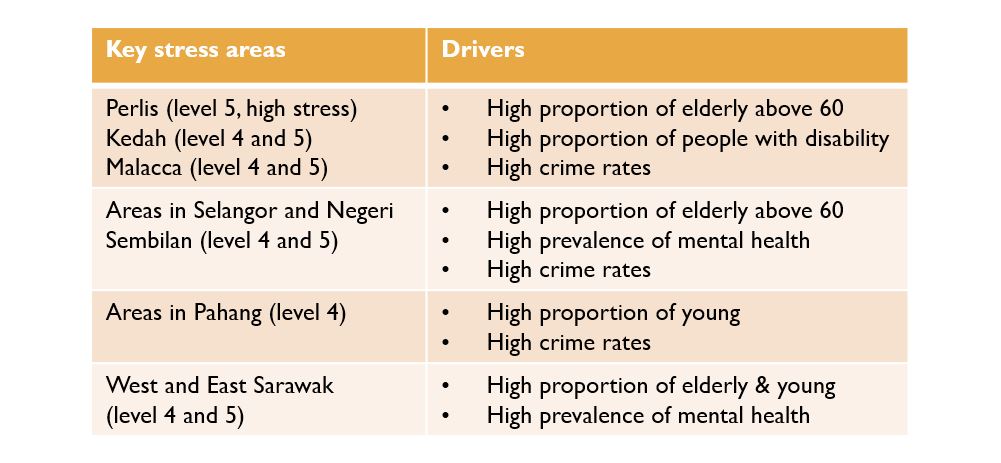
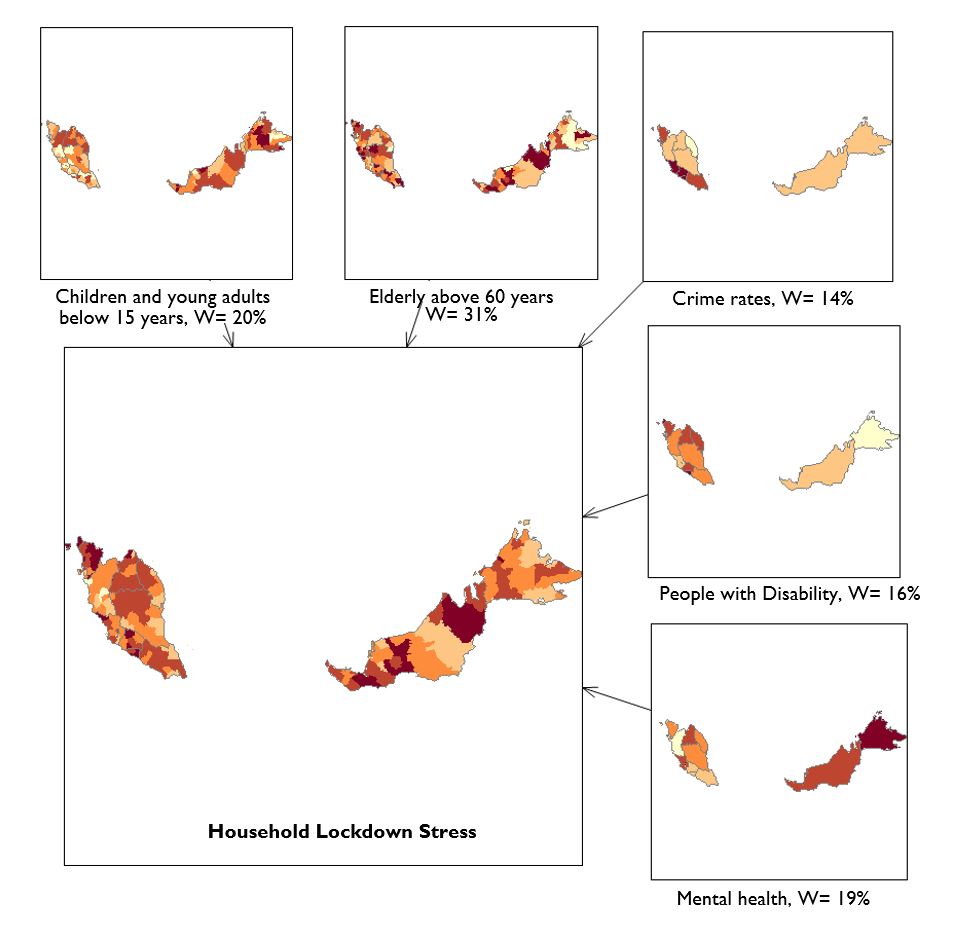
2. Household Lockdown Stress
The table highlights areas where households are likely to experience higher stress during lockdown, based on the level of required dependency care. This is assessed by the proportion of elderly, proportion of children and young adults, prevalence of mental health conditions, proportion of people with disabilities, and crime rates.
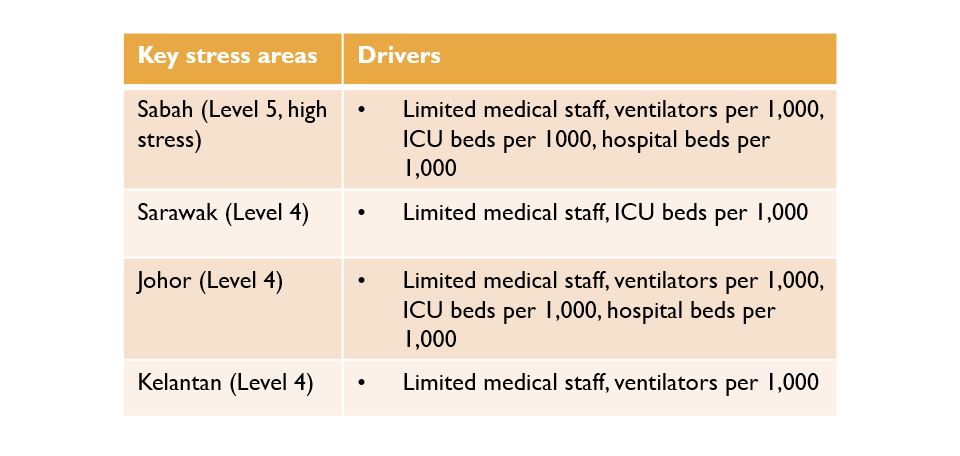
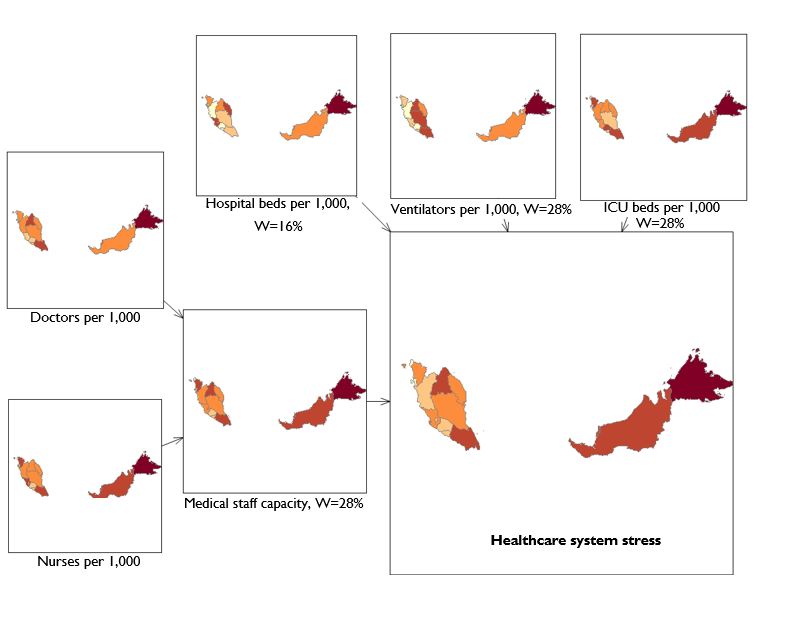
3. Healthcare System Stress
The table highlights areas where the healthcare systems are likely to experience more stress due to lower medical staff capacity, lower availability of ICU beds, lower number of ICU ventilators, and a lower number of hospital beds.
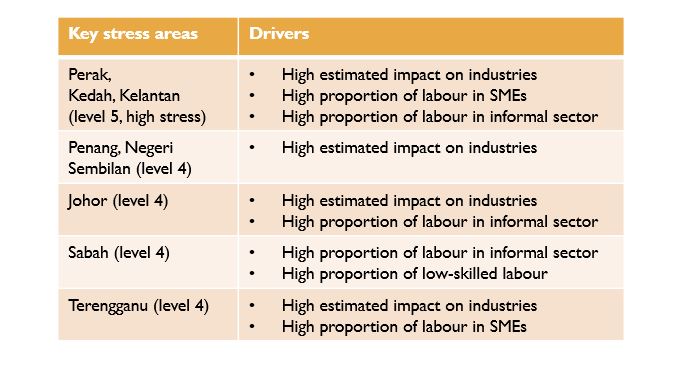
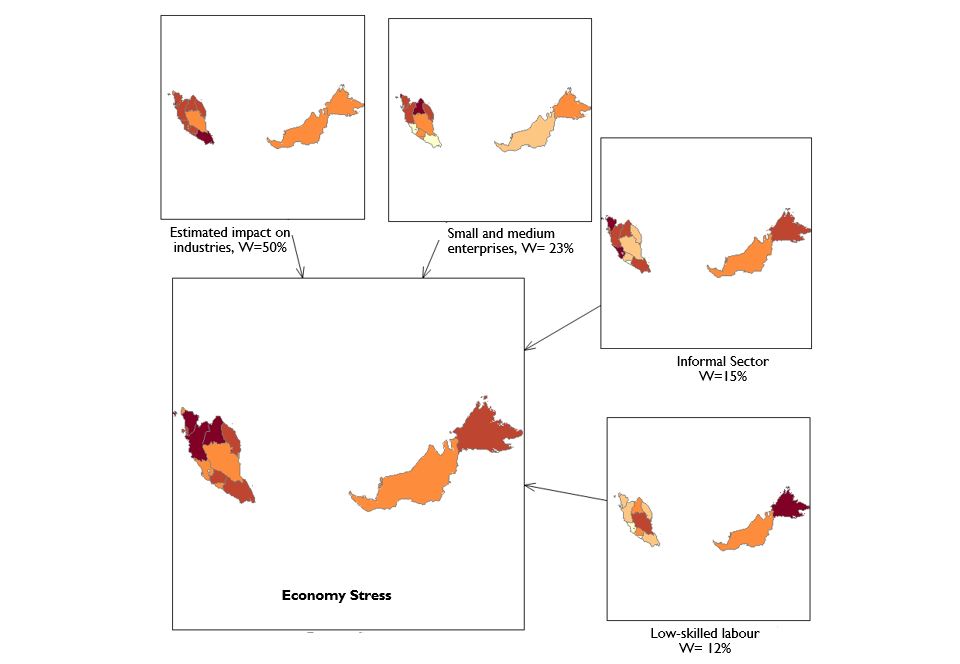
4. Economic Stress
The table shows areas where the economy is likely to experience higher stress levels based on the level of unemployment risk. This is assessed by the estimated impact on volatile industries, proportion of labour in small and medium enterprises, proportion of labour in the informal sector, and proportion of labour in low-skilled work.
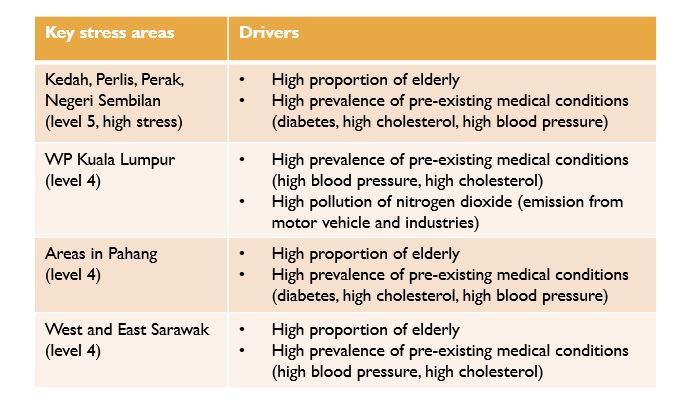
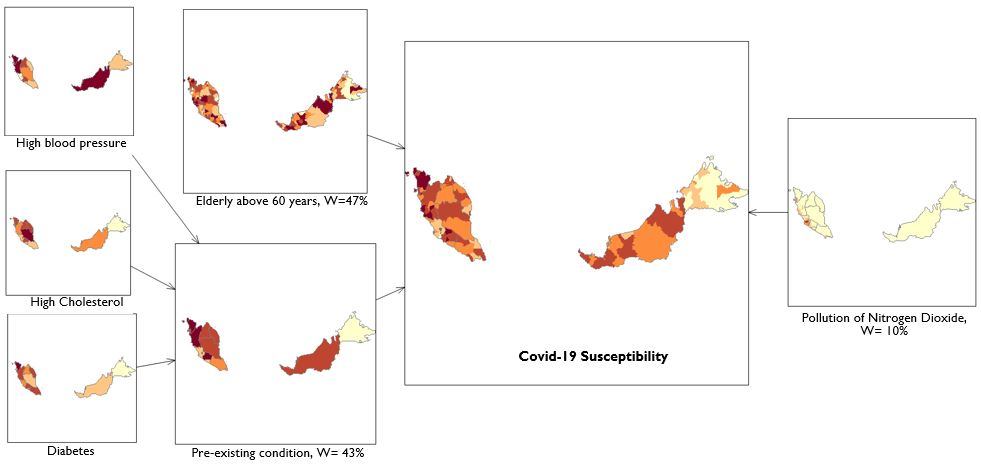
5. Covid-19 Susceptibility
The table highlights areas where the population may be more susceptible to Covid-19 due to a higher prevalence of pre-existing medical conditions, higher proportion of the elderly in the population, and higher pollution of nitrogen dioxide, emission from motor vehicle and industries.
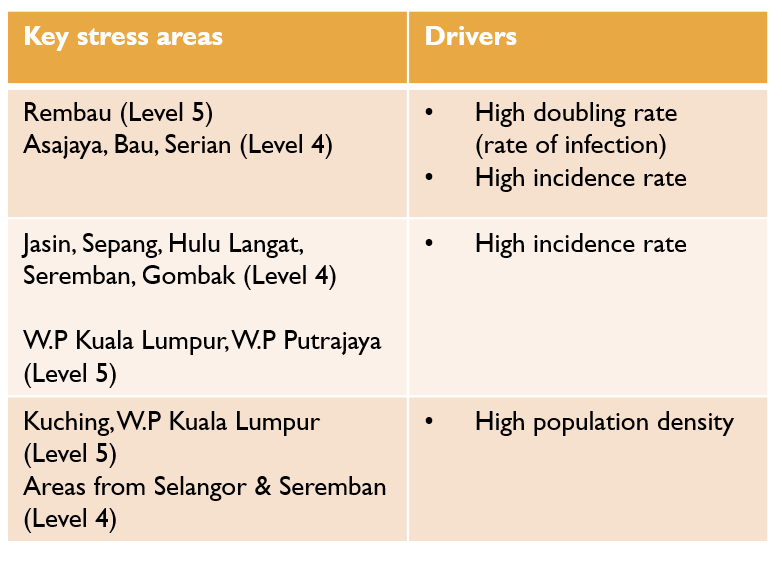
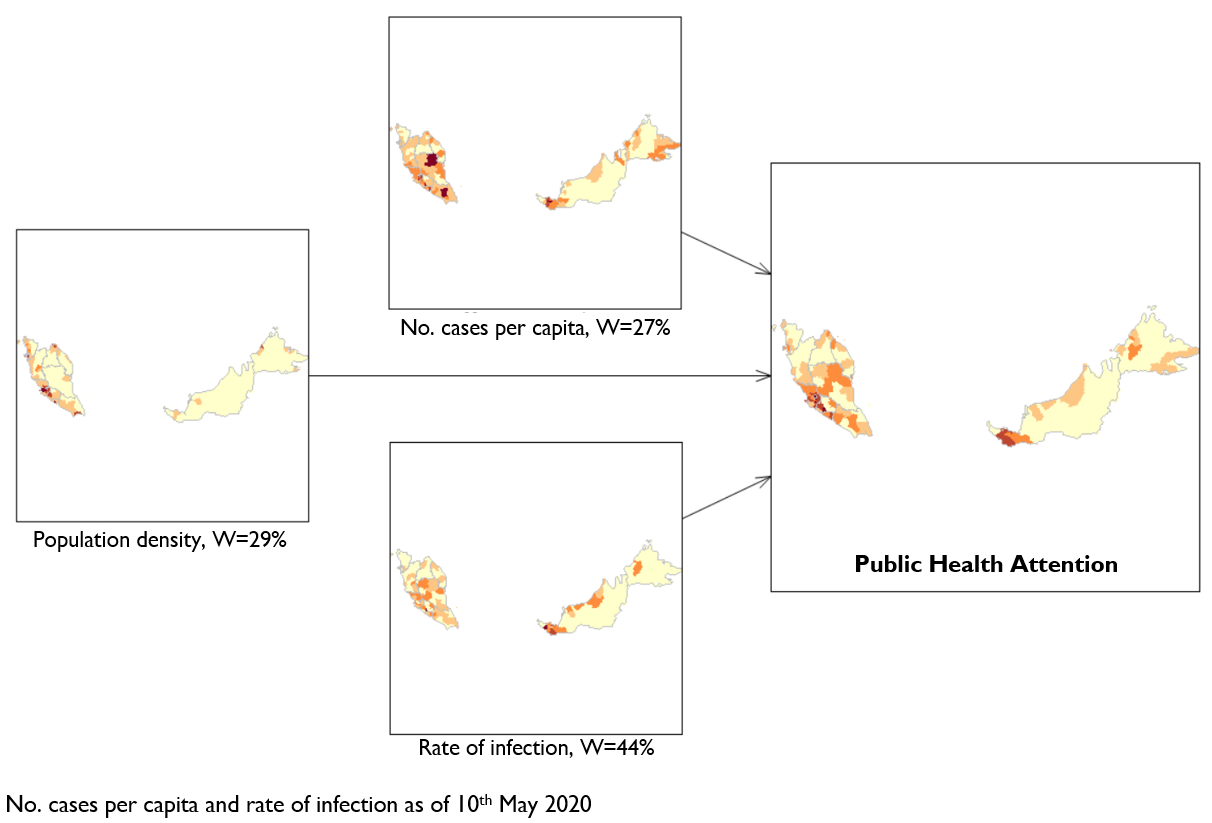
6. Covid-19 Public Health Attention
The table highlights areas that require higher public health attention as they are more at risk of being hotspots for Covid-19 due to higher population densities, higher number of cases per capita, and higher rates of infection.
Public health attention dated 30th March, 2nd, 13th April and 10th May show the distribution of different areas in urban and rural at risk of being hotspots and require high level of public health attention (expand legend and scroll down to bottom layers of maps).
Top Three Insights
- Remote areas are vulnerable due to poorer health systems, higher cases of pre-existing health conditions, and a higher proportion of the elderly population.
- Areas highly reliant on global connections (e.g. electronics, manufacturing, transportation, tourism) are highly vulnerable.
- Whilst cities will bear the brunt of the Covid-19 infections, peri-urban, rural, and remote communities will suffer lasting impacts.
What can we do?
"The nation, as a collective, needs to work together and leverage on the collective know-how of policy-makers and thought leaders in the country to take swift and decisive action in managing the Covid-19 outbreak, which will likely last for several months and prepare for longer-term changes in the post-Covid19 world."
"The medical crisis that we are facing now is just the tip of the iceberg of the global economic and social crises that will follow. Although some measures have been announced by the local government – as a nation, we need to actively monitor global intelligence and movements, and act swiftly on them."
Read more at: https://marketingmagazine.com.my/think-citymsia-mu...
Contact Us:
If you would like to use our data, collaborate, provide feedback, or have queries, please reach out here: ceelia.leong@thinkcity.com.my
11 May 2020
Copyright © 2020 Think City Sdn Bhd. All rights reserved.
Source
Household finance stress
Food prices - Department of Statistics Malaysia (DOSM). (2020). Consumer Price Index.
Internet usage - Malaysia Communications and Multimedia Commission (MCM). (2019). Communications and Multimedia facts and figures, 1Q 2019, Malaysia.
Unemployment and level of education - DOSM. (2018). My local stats, 2018
Income inequality (gini coefficient) and income median - DOSM. (2016). Household income and basic amenities survey report by state and administrative district.
Household lockdown stress
People with disability - DOSM. (2019). Social Statistics Bulletin.
Crime rates - DOSM. (2018). Crime Statistics Malaysia.
Elderly and young population - DOSM (2010). Population Distribution by local authorities areas and mukims.
Mental health - Institute of Public Health,Ministry of Health. (2015). National health and morbidity survey - Non-communicable diseases, risk factors and other health problems, vol II.
Healthcare system stress
Medical staff and hospital beds - DOSM. (2019). Social Statistics Bulletin.
ICU beds - Malaysian Registry of Intensive care, Clinical Research Centre, Ministry of Health (2017). Annual Report.
Ventilators - Clinical Research Centre (2009). National Medical Device Statistics. (Note: the only detail public record available)
Economy stress
Estimated impact on industry and low-skilled labour - (2018). My local stats, 2018
SMEs labour - DOSM. (2017). Economic Census - Profile or Small and Medium Enterprise.
Informal sector labour - DOSM. (2017). Informal Sector Workforce Survey Report.
Covid-19 Susceptibility
Elderly population - DOSM. (2010). Population Distribution by local authorities areas and mukims.
Pre-existing medical condition (diabetes, high cholesterol, high blood pressure) - Institute of Public Health, Ministry of Health. (2015). National health and morbidity survey - Non-communicable diseases, risk factors and other health problems, vol II.
Pollution of Nitrogen Dioxide - Google Earth Engine (2020). Sentinel 5-P near real time nitrogen dioxide emission from March 18 - April 13, 2019.
Covid-19 Public Health Attention
Population density - DOSM. (2018). My local stats, 2018
No. cases per capita and rate of infection - Ministry of Health (2020). Daily reporting from Desk of Director General of Health Malaysia.
2020 Coronavirus Pandemic in Malaysia
Software
ABARES (Department of Agriculture and Water Resources, Australian Government).
Multi-Criteria Analysis Shell MCAS-S for spatial decision support
ESRI ArcGIS

Covid-19 Crisis: Atlas of Community Resilience
Modelling the potential impacts of Covid-19
-
titleWelcome