Note:
Map data was derived from these sources: USGS (including BLM & BIA) data current as of 2014; U.S. Census Bureau (population density data current as of 2010 and population estimates as of 2016); and state and local government data sourced from Plumas County Assessor (data current as of 2016).
Plumas County
POPULATION TRENDS
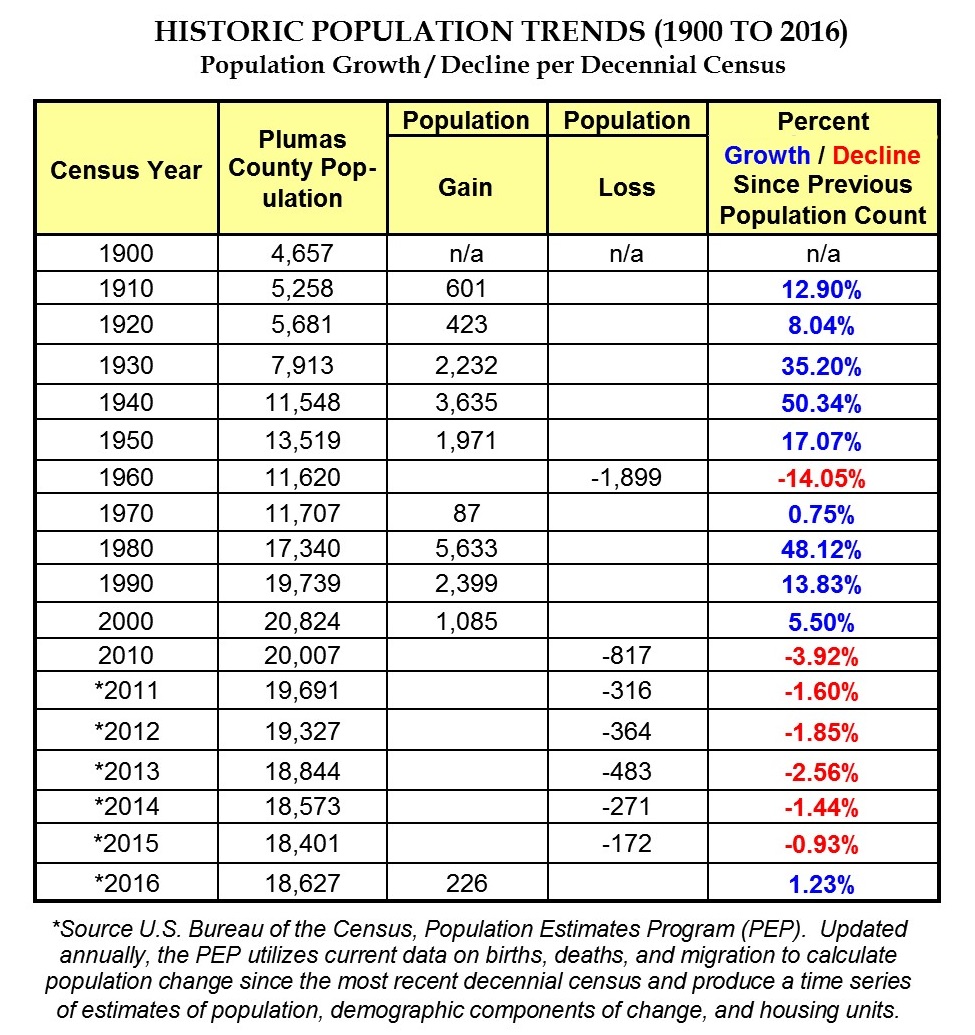
(Click chart above to enlarge view)
LAND OWNERSHIP (2010 Census)
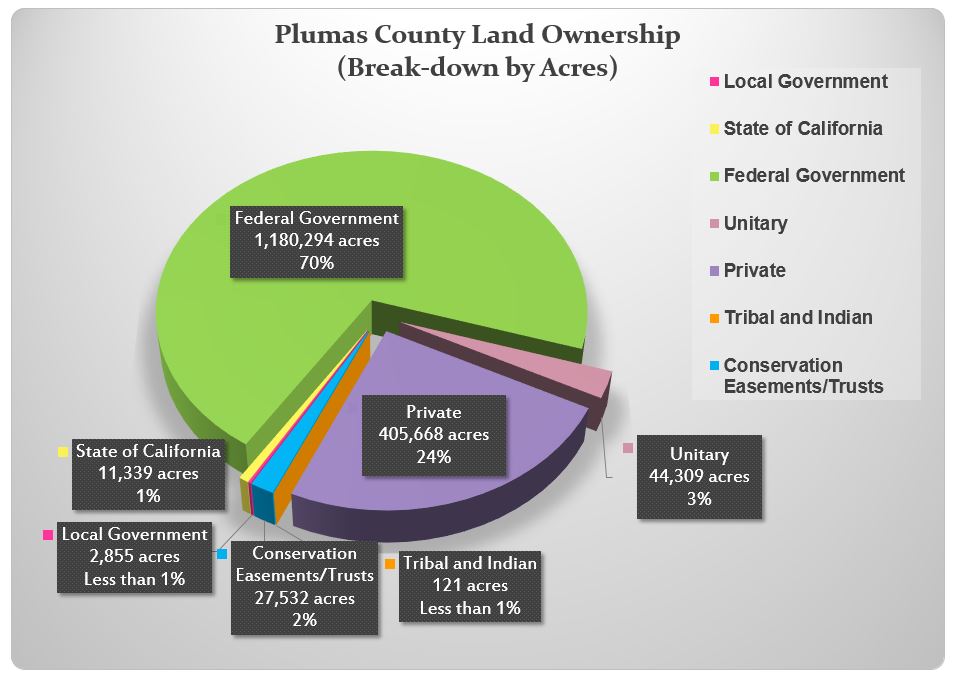 (Click pie chart above to enlarge view)
Land Ownership Key
Local Government: Land owned by the county, city, school districts and special purpose districts or other local authority-owned land with no tax value assessed.
State of California: Land under the jurisdiction of an agency of the State of California.
Tribal and Indian Land: Tribal and Indian owned land.
Federal Land: Federal public lands managed for various purposes differing statutory authority. These lands are generally open to public use subject to the regulations of the managing agency.
Unitary: Property owned or used by public utilities (e.g. railroads, power generating plants, and utilities) and assessed by the State of California's Board of Equalization.
Note: The total acreage listed includes land with water and land owned by another party (e.g. Federal Land) but managed/operated for a unitary purpose.
Conservation Easements/Trusts: Land with a contractual binding agreement under which the landowner, permanently or during a time period specified in the agreement, agrees to conserve or restore habitat, open space, scenic or other ecological resource values on the land covered by the easement.
Private: Land not held by any other governmental agency (all other property not listed in this chart).
Population Trends & Land Ownership
Historic population trends from 1900-2016 and type of land ownership.
CLICK on anywhere on the map to determine property ownership type.
-
About Us
Plumas County Geographic Information Systems (GIS) is a division of Plumas County's Planning Services. GIS develops, maintains and distributes spatial information to aid in the creation of maps and data analysis to support County departments and their customers.
Contact Info
Questions about Plumas County's GIS program should be directed to:
Becky Osborn, GIS Coordinator
555 Main Street
Quincy, CA 95971
Phone: (530) 283-6420
FAX: (530) 283-6134 / Email: beckyosborn@countyofplumas.com
Visit our Website:
