Click on the "
+" to zoom in at a generalized location. To zoom in to a more specific area, click on the map itself. The map will be redrawn at twice the current resolution. The map will be centered on the point where you clicked.
Zoom-Out
Click on the "
-" to zoom out at a generalized location.
Print
Create high quality map prints with feature highlights and popup windows.
Refresh Map Tool
This tool when pressed takes the map back to its default position.
NAVIGATING TOOLS
Information & Tool Pop-Ups
Open and close the Feature Information, Tool Bar, and Header/Menu pop-up outs by clicking the
Moving Around
To pan around on the map (move side to side or up and down) click, hold, and drag.
Feature Info Pop-up
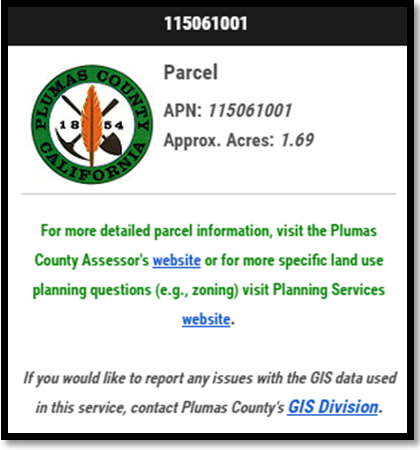
Opens when a feature is clicked on. Most features when "clicked on" will have a "Pop up". This feature provides basic information about the feature that you have clicked on.
Header/Menu Bar
This will collapse if you click the "up arrow" located at left-hand edge:
Located in the lower right-hand corner of the map screen:
Map Legend
Expand the
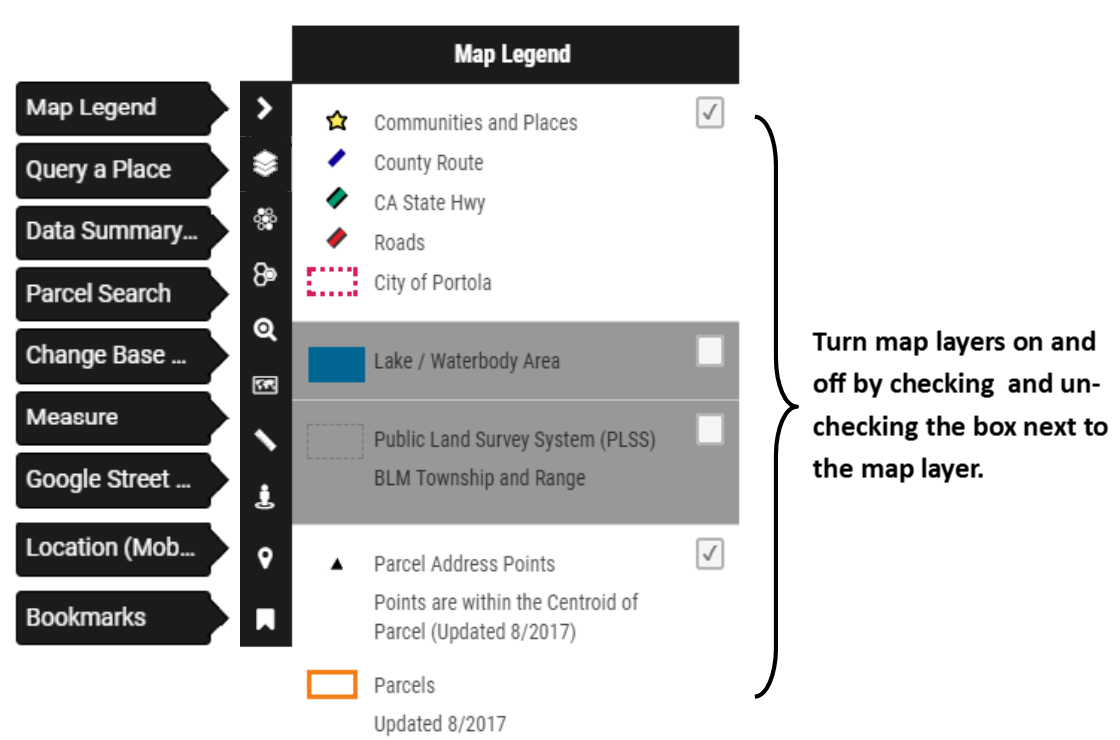
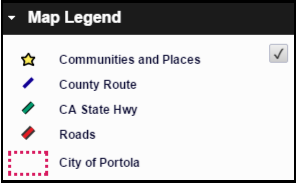
Map Legend window in the lower right-hand corner of the map screen. All features in the legend denoted with a "check box" can be turned "On" or "Off". Only a couple of the features will be checked when the program opens. These are preset so that your computer will be able to process the data faster. NOTE: Some layers (depending on the data source and your network speed) may take some time to render.
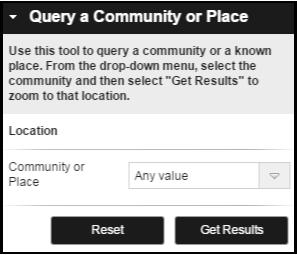
Query a Community or Place
The
Query a Community or Place Tool is used to as a quick "jump-to" to a known community or a known place. Select your desired location from the drop-down menu. Click 'Get Results' and zoom to that location.
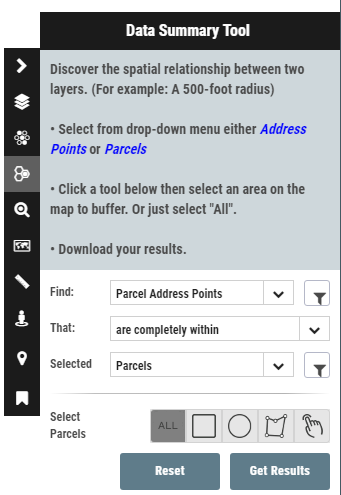
Data Summary Tool
The
Data Summary Tool will allow you to select features in one layer and then find features in a second layer that meet certain criteria (e.g., intersect within a certain distance). Selection tools include radius, box, shape, and attribute filters. Click 'Get Results' and export your data.
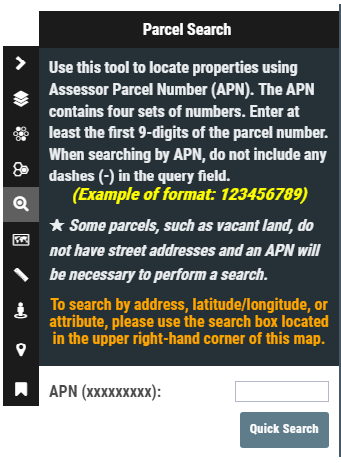
Parcel Search
Type an Assessor Parcel Number (APN) into the search box (in this format: 123456789) and click "Go". The map will automatically zoom to the location and highlight your query.
Quick Address Search, Parcel or Coordinate Search
Select an option under the address field. Type an address (select
Address), coordinates (select Coordinate for Latitude/Longitude) or parcel number (select Data and type the parcel number in this format: 123456789) into the
Search Box (located in the upper right-hand corner of the map screen. The map will automatically zoom to the location.
Change the Basemap
You may select from a number of basemaps including HERE aerial imagery, terrain, topographic and street maps and HERE Maps roads, satellite, hybrid, and terrain.
Create Printable PDF
Create a printable version of your customized map in Adobe's Portable Document Format (PDF). It may take some time to generate the PDF.
Measure (Draw On the Map)
Select a draw tool and the window will automatically close and you can begin adding shapes to your map to highlight an area or specify a certain point. The tool will also calculate distance and area. Double click to close polygons.
Google Street View
This tool seamlessly integrates Google's Street View with your map.
Geolocation
Zoom to your current location and track your movements on your mobile, tablet or netbook device. When activated, your location will be identified on the map. This feature requires the user to authorize their web browser to know their location.
Bookmarks
Quickly zoom to any saved bookmarks you created. Use the toolbar at the top of the map to create a bookmark.
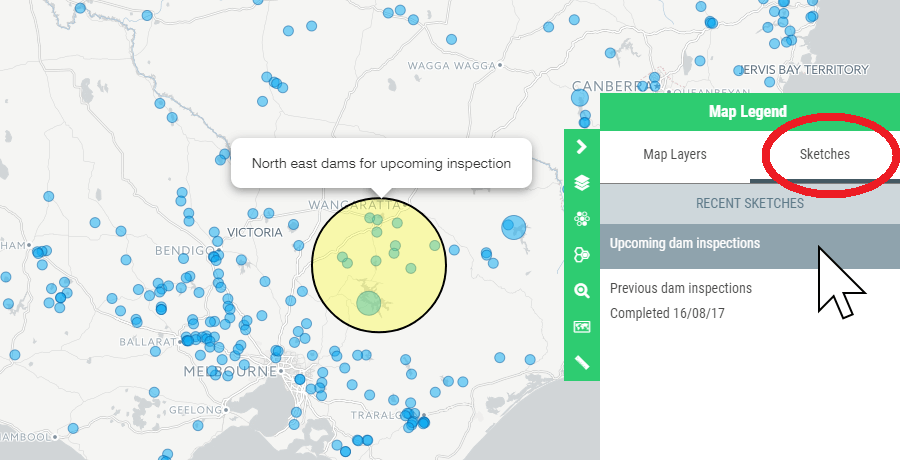
Click on
Sketches within the Map Legend to enable the tool.
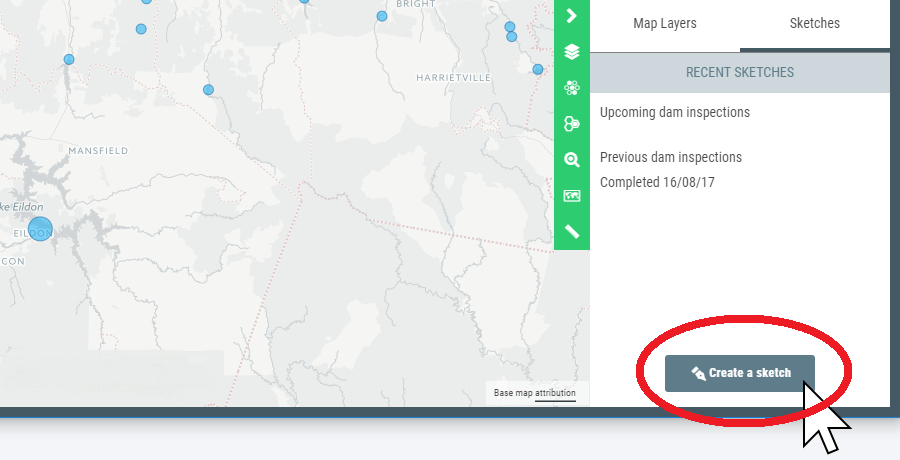
To create a sketch, click on the Sketch tab and click on the
Create a Sketch button at the bottom of the Sketch panel.
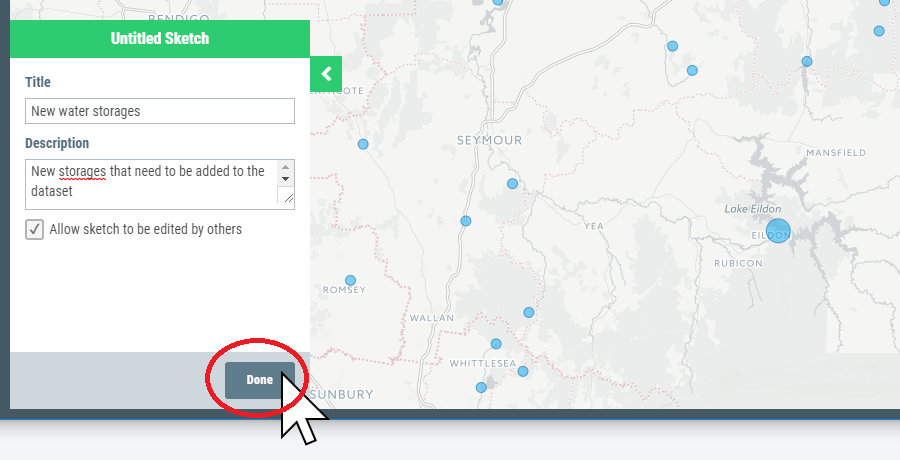
The Sketch panel will open on the left hand side of your map. Here you can set a name and description for the sketch.
Sketches are designed to be shared and worked on collaboratively, so by default new sketches can be edited by anyone with the sketch URL. If you would like to prevent others from editing your sketch, uncheck the box "Allow sketch to be edited by others".
Once you have set your sketch name and edit settings, click
Done to continue to the drawing tools.
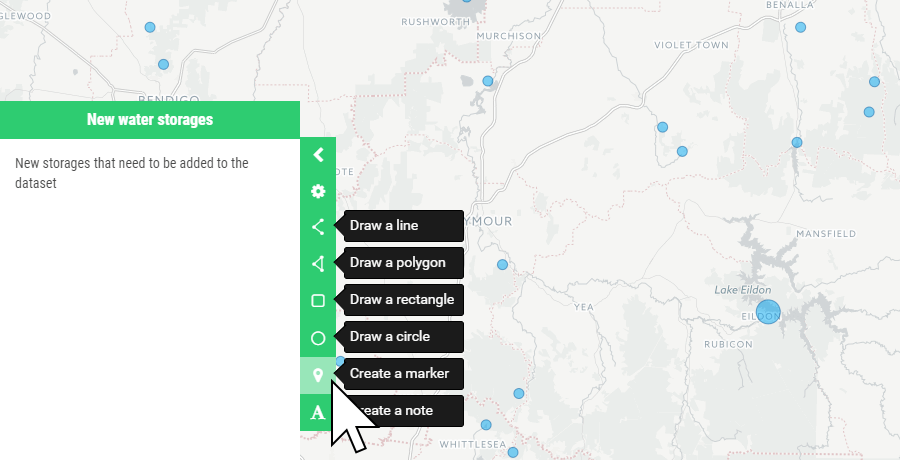
Sketch allows you to create line, polygon, rectangle, oval, marker, and text annotations on your maps.
To place a marker, select
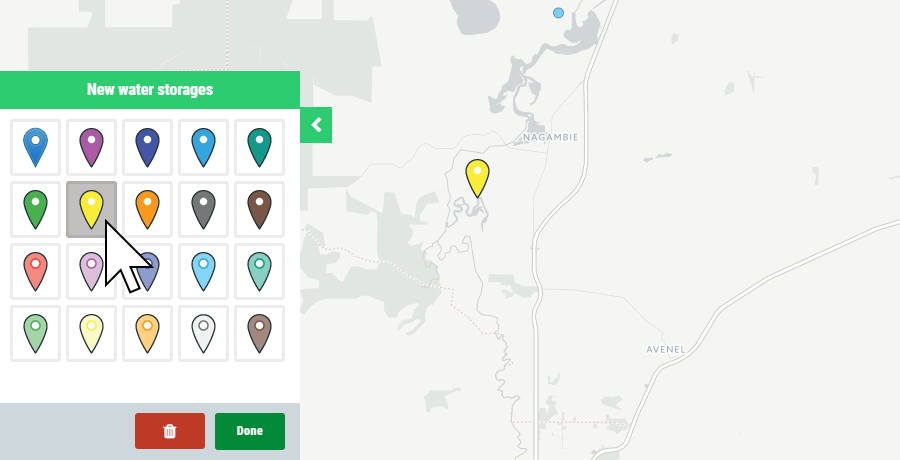
Create a marker from the tool bar and click on the map to place the marker. You can select a color from the range provided. If you need to re-position the marker, simple hover your mouse over the marker, and click and drag the marker to the preferred location.
To save the marker, click the
Done button.
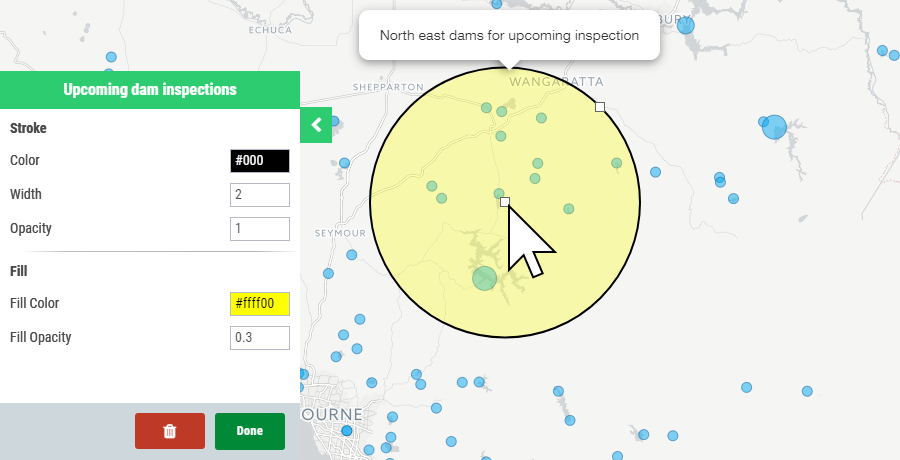
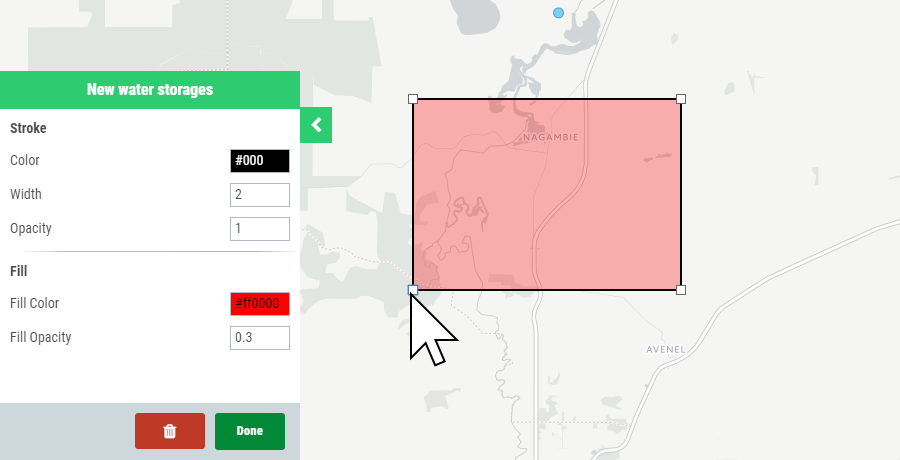
To draw a shape, click on the corresponding icon on the right of the sketch panel, and start drawing. You can adjust the line and fill colors and opacity of lines and shapes, and the text content of annotations.
To adjust the size or position of shapes, click on the white box nodes and drag to your preferred shape or size.
NOTE:
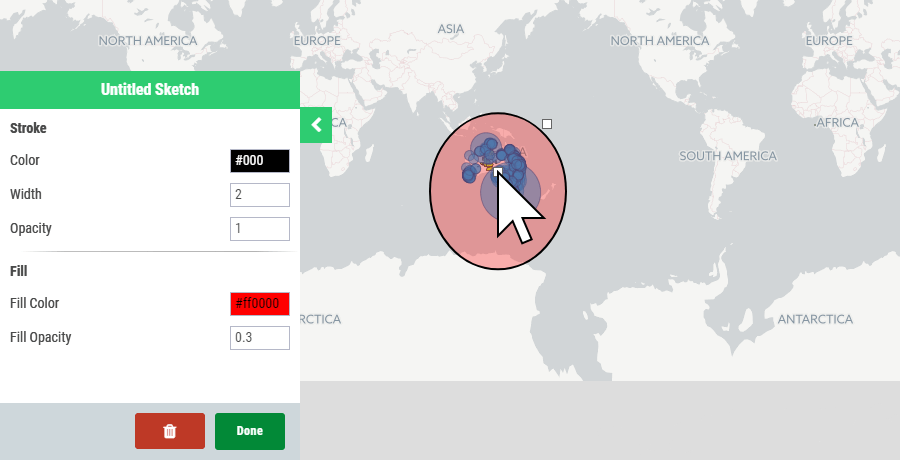
Extremely large circles may appear to be compressed if placed near the top or bottom of the map boundary; however, they occupy the same amount of area. This is due to the distortion of the web Mercator map projection.
To protect your privacy, we do not display property identity/ownership information in any searches you perform on this site. Section 6254.21 of the California Government Code prohibits the posting of home addresses or telephone numbers of any elected or appointed official (or their family) on the Internet without first obtaining the written permission of that individual. Effective January 1, 2003 Chapter 621 amends section 6254.21 to extend this prohibition to “public safety officials" (and their family).
Due to the difficulty of identifying all such officials (and their families) and duly removing their names and addresses from the Internet enabled databases that may be part of the record, we do not make these records available via the Internet.
The data accessed through this website provides a visual display of geographical information as a public resource of general information for use "AS IS," "AS AVAILABLE" and "WITH ALL FAULTS" basis. The data presented are aggregated from a wide variety of sources. We have attempted to integrate these various data sources as well as possible. Each agency providing data may have their own internal standards for accuracy and timeliness, thus the GIS division cannot guarantee the degree to which the various data sources agree with each other. While every reasonable effort has been made to ensure the content, sequence, accuracy, timeliness or completeness of materials presented within this data, Plumas County GIS shall assume no liability for: 1. Any errors, omissions, or inaccuracies in the information provided, regardless of how caused; or 2. Any decision made or action taken or not taken by user in reliance upon any information or data furnished hereunder.
In any situation where the official printed publications of Plumas County differ from the text or graphical representations contained in this system, the
official printed documents take precedence. If misleading, inaccurate or otherwise inappropriate information is brought to the County's attention, a reasonable effort will be made to fix or remove it.
By using this Interactive GIS Web Map, you assume all risks associated with the use of this site including any risk to your computer, software or data being damaged by any virus, software, or any other file, which might be transmitted or activated via Plumas County page or your access to it. Therefore, by using this website for any purpose, users agree to indemnify, defend, and hold Plumas County harmless for any and all liability of any nature arising out of or resulting from the lack of accuracy or correctness of the data, or the use of the data presented on the website.
Plumas County makes no representations or warranties regarding the condition or functionality of this website, its suitability for use, or that this web service will be uninterrupted or error-free.
Use Restrictions:
* All GIS data have inherent spatial inaccuracies, including satellite imagery. Sometimes, the satellite data (which is based on latitude and longitude coordinates acquired before the flight) will not match correctly with parcel or road data and may have varying degrees of accuracy. Satellite images may have feature displacement and scale variation caused by differences in elevation, lens distortion, and camera tilt. Parcel boundary lines should be considered a graphical representation and not in any way a legal survey or engineering document.
* This data is for visual representation only and may not contain all data that is available by contacting Plumas County Planning Services or GIS directly.
* The Plumas County GIS data is for informational purposes only and should not be used to determine precise boundaries, parcel boundaries, appraisal, engineering, nor legal descriptions. The Plumas County GIS data shall not be construed to be an official survey. Site specific evaluation should be verified by field inspection. In addition, land information is constantly changing and the most current or accurate data might not be represented herein.
* Primary sources from which this data was compiled must be consulted for verification of information contained in this data. Contact the appropriate County Department to obtain original source documents or for official determinations. You may also contact the Plumas County Planning Services at (530) 283-7011 for more information.
Read the liability disclaimer and use restrictions carefully. By clicking the "ACCEPT" button, you agree that you have read and understand the preceding information and you will be able to enter the online mapping and data download page.
Updated 8/2024. Points are generally within the Centroid of Parcel
CA State Hwy
County Route
Roads
Lake / Waterbody Area
City of Portola
Parcels
Updated 8/2024. Boundaries represent general location only and should not be used as the exact legal boundary location. Do not use for survey purposes.
Subdivisions
PLSS Township
Public Land Survey System (BLM) Township
PLSS Sections
Public Land Survey System (BLM) Sections
Elevation Contours.
Lines of equal elevation. Lines are at 40-foot intervals.
Topo
WMS USGS Online service. Will take time to Load.
May be offline at times. (Zoom out or refresh if it doesn't load)
Center your desired location under the cross hairs and click the launch streetview button.
Launch Streetview
Measure distances
Measure areas
Reset
Selection Table
Your browser is out of date! Update your browser to view this website correctly.