About
This map shows how you can summarize resident and working population information, based on their proximity to an outlet. Using this map, you better understand the demographics of the local area and what drives sales success.
Summarize customers by store
Click the Proximity Tool and choose the settings as per the example below;
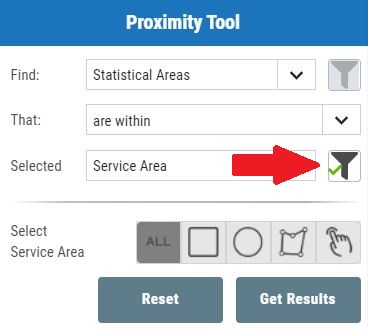
Click the Filter button next to the Locations and choose a store location.
Then click Get Results. You can then view the results as a table, download the results or click Summary Report. The summary report will give total population etc.
Plan a new location
Type in an address for a new store e.g. "Manly". Click the first result in the list.
Actvate the Query Tool and draw a 2km circle around the push pin
Then click Get Results. You can then view the results as a table, download the results or click Summary Report. The summary report will give total population etc.
Map for demonstration purposes only.
Business Location Demographics - Sydney
Explore the relationship between a store and people living and working in the area
Store Locations
Service Area (2km)
Statistical Areas
 CREATED WITH
MANGO
CREATED WITH
MANGO